
 数据结构
数据结构 网络
网络 RDBMS
RDBMS 操作系统
操作系统 Java
Java iOS
iOS HTML
HTML CSS
CSS Android
 Python
 C 编程
C 编程 C++
C++ C#
C# MongoDB
 MySQL
MySQL Javascript
 PHP
PHP如何在 Matplotlib 中获取笛卡尔坐标系?
如果要在 matplotlib 中绘制笛卡尔坐标系,我们可以采取以下步骤 -
- 使用一个值初始化变量 (N)。
- 为 x 和 y 创建随机数据点。
- 使用 x 和 y 数据点通过 scatter 方法绘制点。
- 要显示图形,请使用 show() 方法。
示例
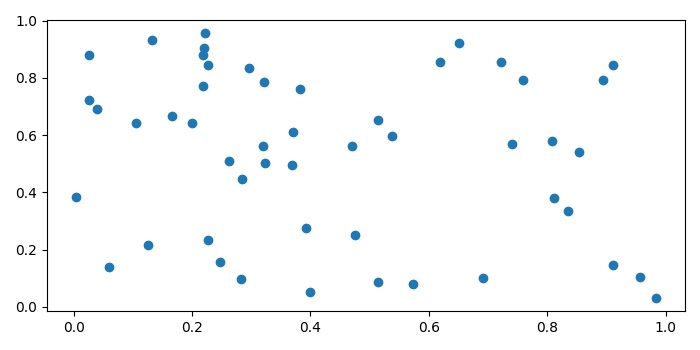
import numpy as np
import matplotlib.pyplot as plt
plt.rcParams["figure.figsize"] = [7.00, 3.50]
plt.rcParams["figure.autolayout"] = True
N = 50
x = np.random.rand(N)
y = np.random.rand(N)
plt.scatter(x, y)
plt.show()
输出

更新于:15-May-2021
695 次浏览

广告