
 数据结构
数据结构 网络
网络 关系型数据库管理系统
 操作系统
操作系统 Java
Java iOS
iOS HTML
HTML CSS
CSS Android
 Python
 C 编程
C 编程 C++
C++ C#
C# MongoDB
 MySQL
MySQL Javascript
 PHP
PHP如何使用 matplotlib 在 X 轴上追加一个带有标签的刻度?
要使用 matplotlib 在 X 轴上追加一个带有标签的刻度,我们可以采取以下步骤。
步骤
设置图片大小,调整子图之间的内边距和周围的内边距。
使用 numpy 创建x 和y 数据点。
使用plot() 方法绘制 x 和 y 数据点。
在一个点设置xticks。
设置单个刻度点的刻度标签。
要显示图片,请使用Show() 方法。
举例
import numpy as np
import matplotlib.pyplot as plt

# Set the figure size
plt.rcParams["figure.figsize"] = [7.00, 3.50]
plt.rcParams["figure.autolayout"] = True

# Create x and y data points
x = np.linspace(-5, 5, 50)
y = np.sin(x)

# Plot x and y data points
fig, ax = plt.subplots(1, 1)
p = ax.plot(x, y)

# Set xticks at a point
ax.set_xticks([-1.075])

# Set xticklabels for the point
ax.set_xticklabels(["$\bf{It\ is -\!1.075\ label}$"])

# Display the plot
plt.show()
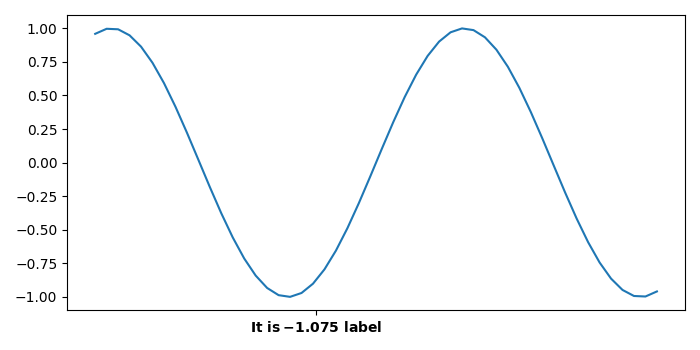
输出
它将产生以下输出 −

更新于:2021 年 10 月 9 日
2K+ 浏览

广告