
 数据结构
数据结构 网络
网络 RDBMS
RDBMS 操作系统
操作系统 Java
Java iOS
iOS HTML
HTML CSS
CSS Android
 Python
 C 编程
C 编程 C++
C++ C#
C# MongoDB
 MySQL
MySQL Javascript
 PHP
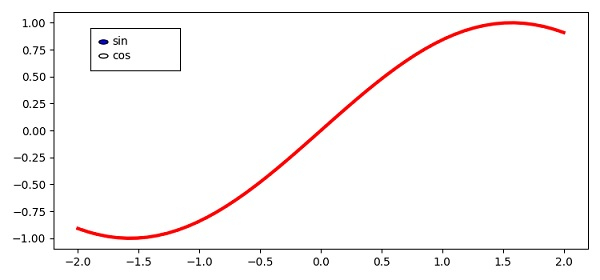
PHP如何使用 Matplotlib 中的单选按钮更改曲线?
要通过单选按钮更改曲线的颜色,我们可以执行以下步骤 -
使用 numpy 创建 x、sin 和 cos 数据点。
调整子图之间及周围的图形大小和填充。
使用 subplots() 方法创建一个图形和一组子图。
使用 plot() 方法绘制包含 x 和 y 数据点的曲线。
使用 axes() 方法将一个轴添加到当前图形并使其成为当前轴。
将一个单选按钮添加到当前轴。
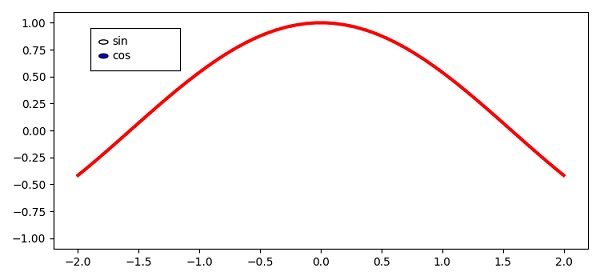
要使用单选按钮更改曲线,我们可以使用 change_curve() 方法,该方法可以传递给 on_clicked() 方法中。
要显示图形,请使用 show() 方法。
示例
import numpy as np
from matplotlib import pyplot as plt
from matplotlib.widgets import RadioButtons

plt.rcParams["figure.figsize"] = [7.50, 3.50]
plt.rcParams["figure.autolayout"] = True

x = np.linspace(-2, 2, 50)
sin = np.sin(x)
cos = np.cos(x)
fig, ax = plt.subplots()
l, = ax.plot(x, sin, lw=3, color='red')
rb_axis = plt.axes([0.15, 0.75, 0.15, 0.15])
radio_button = RadioButtons(rb_axis, ('sin', 'cos'))

def change_curve(c_label):
   d = {'sin': sin, 'cos': cos}
   data = d[c_label]
   l.set_ydata(data)
   plt.draw()

radio_button.on_clicked(change_curve)

plt.show()
输出
现在,单击单选按钮“cos”,将更改绘图 −

更新于:09-Apr-2021
329 次浏览

广告