
 数据结构
数据结构 网络
网络 RDBMS
RDBMS 操作系统
操作系统 Java
Java iOS
iOS HTML
HTML CSS
CSS Android
 Python
 C 编程
C 编程 C++
C++ C#
C# MongoDB
 MySQL
MySQL Javascript
 PHP
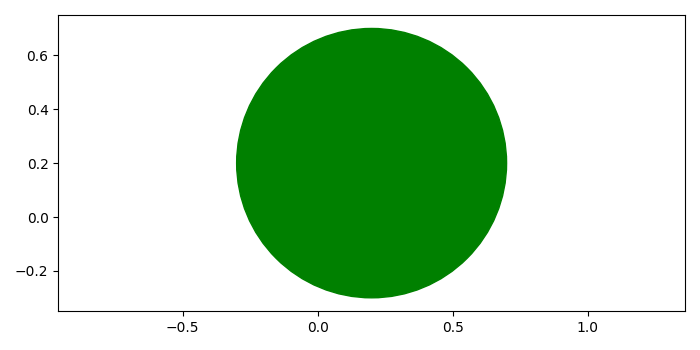
PHP如何在 Matplotlib 中绘制圆形?
要使用 matplotlib 绘制圆形,我们可以执行以下步骤:-
使用 figure() 方法创建新图形或激活现有图形。
向当前轴添加子图布置。
使用 Circle 类在中心创建真正的圆形。
向当前轴添加一个补丁。
设置 x 和 y 轴的限制。
要显示图形,请使用 show() 方法。
示例
from matplotlib import pyplot as plt, patches
plt.rcParams["figure.figsize"] = [7.00, 3.50]
plt.rcParams["figure.autolayout"] = True
fig = plt.figure()
ax = fig.add_subplot()
circle1 = patches.Circle((0.2, 0.2), radius=0.5, color='green')
ax.add_patch(circle1)
ax.axis('equal')
plt.show()
输出

更新于:08-May-2021
14K+ 次浏览

广告