
 数据结构
数据结构 网络
网络 RDBMS
RDBMS 操作系统
操作系统 Java
Java iOS
iOS HTML
HTML CSS
CSS Android
 Python
 C 语言编程
 C++
C++ C#
C# MongoDB
 MySQL
MySQL Javascript
 PHP
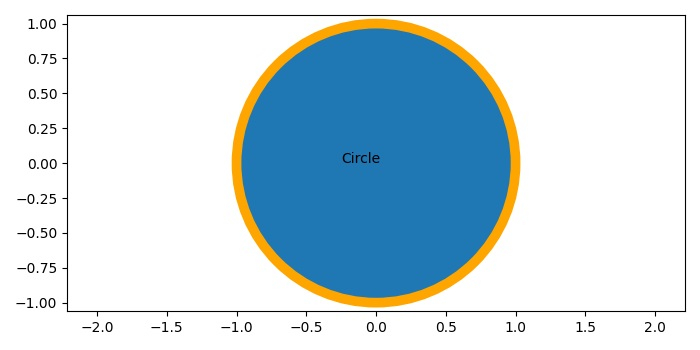
PHP在 Matplotlib 中使用边框颜色绘制一个圆形
若要在 matplotlib 中绘制带有边框颜色的圆形,我们可以按照以下步骤操作 -
使用 **figure()** 方法创建新图形或激活现有图形。
向当前坐标轴添加子图方法。
使用 **Circle()** 类创建 **circle** 实例,其中包含边缘的 **edgecolor** 和 **linewidth**。
在绘图中添加一个圆形路径。
若要在圆中放置文本,我们可以使用 **text()** 方法。
使用 **xlim()** 和 **ylim()** 方法缩放 X 和 Y 坐标轴。
若要显示图形,请使用 **show()** 方法。
举例
import matplotlib
from matplotlib import pyplot as plt, patches
plt.rcParams["figure.figsize"] = [7.00, 3.50]
plt.rcParams["figure.autolayout"] = True
fig = plt.figure()
ax = fig.add_subplot(111)
circle = matplotlib.patches.Circle((0, 0), radius=1, edgecolor="orange", linewidth=7)
ax.add_patch(circle)
plt.text(-.25, 0, "Circle")
plt.xlim([-4, 4])
plt.ylim([-4, 4])
plt.axis('equal')
plt.show()
输出

更新于: 15-May-2021
2K+ 阅读

广告