
 数据结构
数据结构 网络
网络 关系型数据库管理系统
 操作系统
操作系统 Java
Java iOS
iOS HTML
HTML CSS
CSS Android
 Python
 C 编程
C 编程 C++
C++ C#
C# MongoDB
 MySQL
MySQL Javascript
 PHP
PHP如何在 Python 中绘制图形?
可以使用 Matplotlib 库在 Python 中绘制图形。 Matplotlib 库 主要用于图形绘制。
在使用 Matplotlib 绘制图形之前,您需要安装 matplotlib。Matplotlib 用于绘制简单的线条、条形图、直方图和饼图。Matplotlib 库中提供了绘制各种图形的内置函数。
在图形中绘制一条线
我们将使用 matplotlib 在图形中绘制一条简单的线。绘制线条涉及以下步骤。
导入 matplotlib
指定线的 x 坐标和 y 坐标
使用特定函数(使用 .plot() 函数)绘制指定的点
使用 .xlabel() 和 .ylabel() 函数命名 x 轴和 y 轴
使用 .title() 函数为图形添加标题(可选)
使用 .show() 函数显示图形
这些是在使用 matplotlib 绘制线条时涉及的简单步骤。
示例
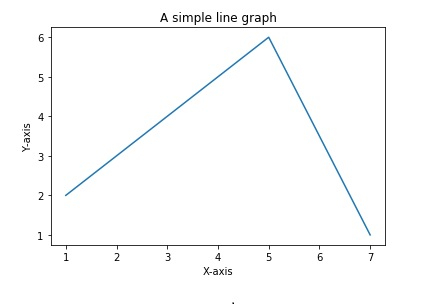
import matplotlib.pyplot as plt

x=[1,3,5,7]
y=[2,4,6,1]
plt.plot(x,y)
plt.xlabel('X-axis')
plt.ylabel('Y-axis')
plt.title("A simple line graph")
plt.show()
以上代码绘制了点 (1,2)、(3,4)、(5,6)、(7,1) 并用线连接这些点,显示为图形。
输出
绘制条形图
条形图是以不同高度的矩形在 x 轴上的特定位置表示数据的方式。
绘制条形图涉及以下步骤:
导入 matplotlib
指定矩形左下角所在的 x 坐标。
指定条形或矩形的高度。
指定条形的标签
使用 .bar() 函数绘制条形图
为 x 轴和 y 轴添加标签
为图形添加标题
使用 .show() 函数显示图形。
示例
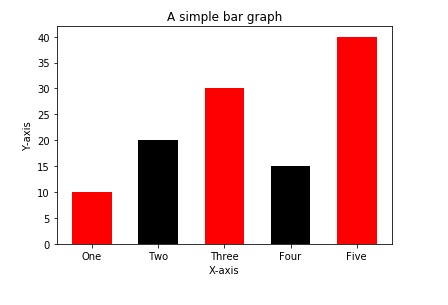
import matplotlib.pyplot as plt

left_coordinates=[1,2,3,4,5]
heights=[10,20,30,15,40]
bar_labels=['One','Two','Three','Four','Five']
plt.bar(left_coordinates,heights,tick_label=bar_labels,width=0.6,color=['re
d','black'])
plt.xlabel('X-axis')
plt.ylabel('Y-axis')
plt.title("A simple bar graph")
plt.show()
plt.bar() 中的 width 参数指定每个条形的宽度。颜色列表指定条形的颜色。
输出

更新于: 2023-08-23
59K+ 浏览量

广告