
 Data Structure
 Networking
 RDBMS
RDBMS Operating System
 Java
Java iOS
iOS HTML
HTML CSS
CSS Android
 Python
 C Programming
 C++
C++ C#
C# MongoDB
 MySQL
MySQL Javascript
 PHP
PHP如何在 Python 中绘制时间序列?
要使用 Matplotlib 在 Python 中绘制时间序列,我们可以采取以下步骤:
使用 Numpy 创建 x 和 y 坐标。
使用 plot() 方法绘制创建的 x 和 y 点。
要显示图形,请使用 show() 方法。
示例
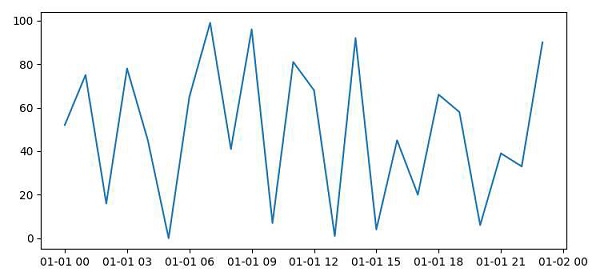
import matplotlib.pyplot as plt
import datetime
import numpy as np
plt.rcParams["figure.figsize"] = [7.50, 3.50]
plt.rcParams["figure.autolayout"] = True
x = np.array([datetime.datetime(2021, 1, 1, i, 0) for i in range(24)])
y = np.random.randint(100, size=x.shape)
plt.plot(x, y)
plt.show()
输出

更新时间: 09-Apr-2021
3K+ 浏览

广告