
 数据结构
数据结构 网络
网络 RDBMS
RDBMS 操作系统
操作系统 Java
Java iOS
iOS HTML
HTML CSS
CSS Android
 Python
 C 语言编程
 C++
C++ C#
C# MongoDB
 MySQL
MySQL JavaScript
 PHP
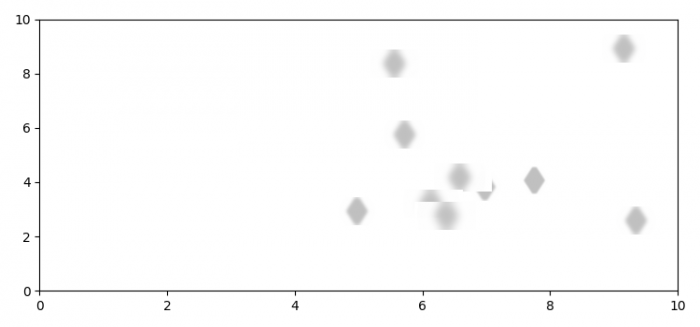
PHP如何在 Matplotlib 中绘制模糊的点?
要在 matplotlib 中绘制模糊的点,我们可以采取以下步骤 −
设置图像大小,调整子图之间和周围的填充。
创建新的图像或激活一个现有的图像。
将 ax1 添加到图像中作为子图排列的一部分。
首先,我们可以制作一个标记,即模糊的标记。
设置 X 和 Y 轴刻度,关闭轴。
将标记保存在文件中,在模糊后加载该图像以便绘制。
关闭之前的图像,fig1。
创建新的图像或激活一个现有的图像,fig2。
创建随机数据点,x 和 y。
应用高斯滤波器来产生模糊,将该艺术品添加到当前的轴上。
在 ax2 上设置 X 和 Y 轴刻度。
要显示图像,使用 show() 方法。
示例
import matplotlib.pyplot as plt
from scipy import ndimage
from matplotlib.image import BboxImage
from matplotlib.transforms import Bbox, TransformedBbox
import numpy as np

plt.rcParams["figure.figsize"] = [7.50, 3.50]
plt.rcParams["figure.autolayout"] = True

fig1 = plt.figure()
ax1 = fig1.add_subplot(111)
ax1.plot(0.5, 0.5, 'd', ms=200)
ax1.set_ylim(0, 1)
ax1.set_xlim(0, 1)
plt.axis('off')
fig1.savefig('marker.png')

marker = plt.imread('marker.png')
plt.close(fig1)

fig2 = plt.figure()
ax2 = fig2.add_subplot(111)

x = 8 * np.random.rand(10) + 1
y = 8 * np.random.rand(10) + 1

sigma = np.arange(10, 60, 5)

for xi, yi, sigmai in zip(x, y, sigma):
   markerBlur = ndimage.gaussian_filter(marker, sigmai)
   bb = Bbox.from_bounds(xi, yi, 1, 1)
   bb2 = TransformedBbox(bb, ax2.transData)
   bbox_image = BboxImage(bb2,norm=None,origin=None, clip_on=False)
   bbox_image.set_data(markerBlur)
   ax2.add_artist(bbox_image)

ax2.set_xlim(0, 10)
ax2.set_ylim(0, 10)

plt.show()
输出

更新于: 2021 年 8 月 9 日
772 次浏览

广告