
 数据结构
数据结构 网络
网络 RDBMS
RDBMS 操作系统
操作系统 Java
Java iOS
iOS HTML
HTML CSS
CSS Android
 Python
 C 编程
C 编程 C++
C++ C#
C# MongoDB
 MySQL
MySQL Javascript
 PHP
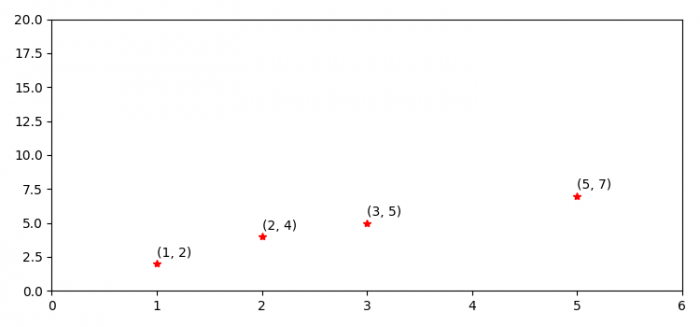
PHP使用 Matplotlib 在 Python 中的绘图中显示点坐标
要在 Python 中的绘图中显示点坐标,我们可以执行以下步骤 −
- 设置图形大小并调整子图之间和周围的间距。
- 创建 x 和 y 数据点的列表。
- 以红色和星号标记绘制 x 和 y 数据点
- 设置一些轴属性。
- 迭代 x 和 y 以显示绘图上的坐标。
示例
import matplotlib.pyplot as plt

plt.rcParams["figure.figsize"] = [7.50, 3.50]
plt.rcParams["figure.autolayout"] = True

x = [3, 1, 2, 5]
y = [5, 2, 4, 7]

plt.plot(x, y, 'r*')
plt.axis([0, 6, 0, 20])

for i, j in zip(x, y):
   plt.text(i, j+0.5, '({}, {})'.format(i, j))

plt.show()
输出

更新于: 07-Jul-2021
16K+ 浏览量

广告