
 数据结构
数据结构 网络
网络 关系型数据库管理系统
 操作系统
操作系统 Java
Java iOS
iOS HTML
HTML CSS
CSS Android
 Python
 C 编程
C 编程 C++
C++ C#
C# MongoDB
 MySQL
MySQL Javascript
 PHP
PHP如何在 Matplotlib 中的地图上绘制时区
让我们考虑一下必须处理实际时间的数据。为了在地图上绘制时区,我们可以在 Python 中使用“cartopy”或“metPy”包。但是,我们可以使用命令在 Anaconda 环境中安装“cartopy”包:
conda install -c conda-forge cartopy
或者
conda install -c conda-forge metpy
现在,让我们看看如何使用 Matplotlib 在地图中绘制时区。
示例
import numpy as np
import cartopy.crs as ccrs
import matplotlib.animation as animation
import matplotlib.pyplot as plt
#Defining the plot size and axes
plt.figure(figsize=(10, 9))
ax = plt.axes(projection=ccrs.PlateCarree())
#Apply the color for the natural Earth sourced from cartopy package
ax.stock_img()
ax.coastlines(zorder=1)
#Reading the timezone using ShapelyFeature of Cartopy
shape_feature = ShapelyFeature(Reader('ne_10m_time_zones.shp').geometries(),
ccrs.PlateCarree(), edgecolor='black')
# Plot the feature on the map
ax.add_feature(shape_feature, alpha=0.4, zorder=5, lw=1)
gl = ax.gridlines(crs=ccrs.PlateCarree(), draw_labels=True,
linewidth=2, color='gray', alpha=0.5, linestyle='--')
#Apply the gridlines to separate the timezones
gl = ax.gridlines(crs=ccrs.PlateCarree(), draw_labels=True,
linewidth=2, color='black', alpha=0.5, linestyle='--')
#Turn off all the axes excluding bottom
gl.xlabels_top = False
gl.ylabels_left = False
gl.ylabels_right = False
#Apply fixed locations with the tickable objects
gl.xlocator = mticker.FixedLocator(np.linspace(-180, 180, 25))
gl.xlabel_style = {'size': 10, 'color': 'blue'}
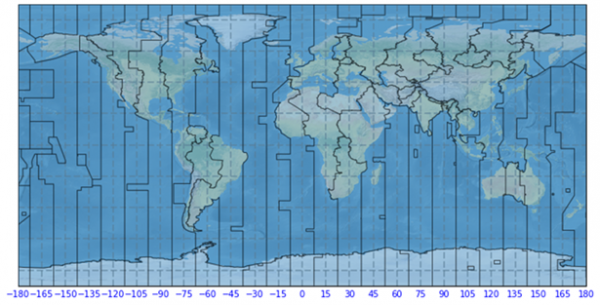
ax.set_title('Global Time Zones', size=15, color='g')
#Display the plots
plt.show()输出
运行以上代码片段将生成输出,如下所示:

更新于: 2021 年 2 月 23 日
340 次浏览

广告