
 数据结构
数据结构 网络
网络 关系型数据库管理系统
 操作系统
操作系统 Java
Java iOS
iOS HTML
HTML CSS
CSS Android
 Python
 C 编程
C 编程 C++
C++ C#
C# MongoDB
 MySQL
MySQL Javascript
 PHP
PHP如何在 JavaFX 图表中设置特定的颜色作为背景?
javafx.scene.chart 包提供了创建各种图表的类,例如:线形图、面积图、柱状图、饼图、气泡图、散点图等。
您可以通过实例化相应的类来创建所需的图表。
设置背景图像和颜色 -
JavaFX CSS 的 -fx-background-color 类用于为图表设置彩色背景。
JavaFX CSS 的 -fx-background-color(区域 chart-plot-background)类用于设置背景颜色。
JavaFX Scene 类具有一个可观察列表,用于保存所有所需的样式表。您可以使用 getStylesheets() 方法获取此列表。
要将图像设置为图表的背景 -
在项目的当前包中创建一个 CSS 文件(例如 LineChart.css)。
使用 -fx-background-color CSS 类设置背景图像,如下所示 -
.chart-plot-background {
   -fx-background-color: DIMGRAY;
}
使用 -fx-background-color CSS 类将绘图颜色设置为透明,如下所示 -
.chart-plot-background {
   -fx-background-color: transparent;
}
在程序中,使用 getStylesheets() 方法获取样式表的可观察列表。
使用 add() 方法将创建的 CSS 文件添加到列表中。
示例
color.CSS -
.chart {
   -fx-padding: 10px;
   -fx-background-color: DIMGRAY;
}
.chart-plot-background {
   -fx-background-color: transparent;
}
.chart-vertical-grid-lines {
   -fx-stroke: #dedddc; -fx-stroke-width: 2;
}
.chart-horizontal-grid-lines {
   -fx-stroke: #dedddc; -fx-stroke-width: 2;
}
JavaFX 程序 -
import javafx.application.Application;
import javafx.scene.Scene;
import javafx.scene.chart.AreaChart;
import javafx.scene.chart.CategoryAxis;
import javafx.stage.Stage;
import javafx.scene.chart.NumberAxis;
import javafx.scene.chart.XYChart;
import javafx.scene.layout.StackPane;
public class AreaChartExample extends Application {
public void start(Stage stage) {
//Defining the X and Y axes
CategoryAxis xAxis = new CategoryAxis();
NumberAxis yAxis = new NumberAxis();
//Setting labels to the axes
xAxis.setLabel("Months");
yAxis.setLabel("Rainfall (mm)");
//Creating the Area chart
AreaChart<String, Number> areaChart = new AreaChart(xAxis, yAxis);
//Prepare data for the area chart
XYChart.Series series = new XYChart.Series();
series.getData().add(new XYChart.Data("Jan", 13.2));
series.getData().add(new XYChart.Data("Feb", 7.9));
series.getData().add(new XYChart.Data("Mar", 15.3));
series.getData().add(new XYChart.Data("Apr", 20.2));
series.getData().add(new XYChart.Data("May", 35.7));
series.getData().add(new XYChart.Data("June", 103.8));
series.getData().add(new XYChart.Data("July", 169.9));
series.getData().add(new XYChart.Data("Aug", 178.7));
series.getData().add(new XYChart.Data("Sep", 158.3));
series.getData().add(new XYChart.Data("Oct", 97.2));
series.getData().add(new XYChart.Data("Nov", 22.4));
series.getData().add(new XYChart.Data("Dec", 5.9));
//Setting the name to the line (series)
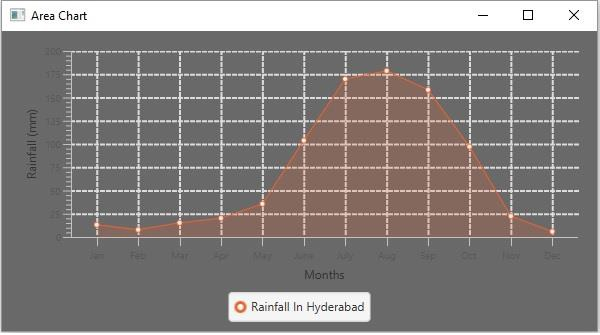
series.setName("Rainfall In Hyderabad");
//Setting data to the area chart
areaChart.getData().addAll(series);
//Creating a stack pane to hold the chart
StackPane pane = new StackPane(areaChart);
//Setting the Scene
Scene scene = new Scene(pane, 595, 300);
stage.setTitle("Area Chart");
stage.setScene(scene);
scene.getStylesheets().add("javafx_transformastions/color.css");
stage.show();
}
public static void main(String args[]){
launch(args);
}
}输出

更新于: 2020年5月19日
923 次浏览

广告