
 数据结构
数据结构 网络
网络 关系数据库管理系统 (RDBMS)
 操作系统
操作系统 Java
Java iOS
iOS HTML
HTML CSS
CSS Android
 Python
 C语言编程
C语言编程 C++
C++ C#
C# MongoDB
 MySQL
MySQL Javascript
 PHP
PHP如何使用JavaFX创建折线图?
内联图表,数据值表示由线连接的一系列点。在JavaFX中,您可以通过实例化**javafx.scene.chart.LineChart类**来创建折线图。
实例化此类时,必须传递Axis类的两个对象,分别代表x轴和y轴(作为构造函数的参数)。由于Axis类是抽象类,因此您需要传递其具体子类的对象,例如NumberAxis(用于数值)或CategoryAxis(用于字符串值)。
创建轴后,可以使用**setLabel()**方法为其设置标签。
设置数据
**XYChart.Series**表示数据项的序列。您可以通过实例化此类来创建折线的一系列点。此类包含一个可观察列表,其中包含序列中的所有点。
**XYChart.Data**表示x-y平面中的特定数据点。要创建点,需要通过传递该点的x值和y值来实例化此类。
因此,要为折线创建数据:
通过实例化**XYChart.Data**类来创建所需数量的点。
通过实例化**XYChart.Series**类来创建序列。
使用**getData()**方法获取XYChart.Series类的可观察列表。
使用**add()**或**addAll()**方法将创建的数据点添加到列表中。
将创建的数据序列添加到折线图中:
linechart.getData().add(series);
示例
import javafx.application.Application;
import javafx.scene.Scene;
import javafx.stage.Stage;
import javafx.scene.chart.LineChart;
import javafx.scene.chart.NumberAxis;
import javafx.scene.chart.XYChart;
import javafx.scene.layout.StackPane;
public class LineChartExample extends Application {
public void start(Stage stage) {
//Defining the x and y axes
NumberAxis xAxis = new NumberAxis();
NumberAxis yAxis = new NumberAxis();
//Setting labels for the axes
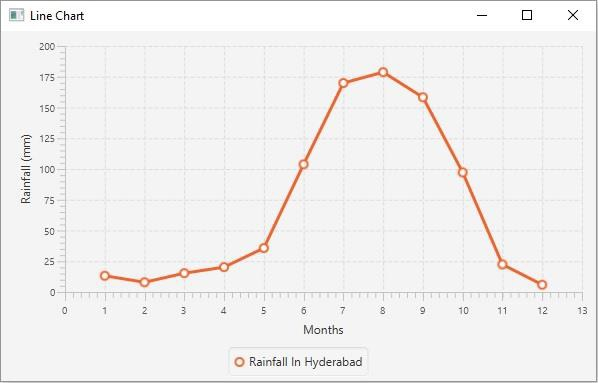
xAxis.setLabel("Months");
yAxis.setLabel("Rainfall (mm)");
//Creating a line chart
LineChart linechart = new LineChart(xAxis, yAxis);
//Preparing the data points for the line1
XYChart.Series series = new XYChart.Series();
series.getData().add(new XYChart.Data(1, 13.2));
series.getData().add(new XYChart.Data(2, 7.9));
series.getData().add(new XYChart.Data(3, 15.3));
series.getData().add(new XYChart.Data(4, 20.2));
series.getData().add(new XYChart.Data(5, 35.7));
series.getData().add(new XYChart.Data(6, 103.8));
series.getData().add(new XYChart.Data(7, 169.9));
series.getData().add(new XYChart.Data(8, 178.7));
series.getData().add(new XYChart.Data(9, 158.3));
series.getData().add(new XYChart.Data(10, 97.2));
series.getData().add(new XYChart.Data(11, 22.4));
series.getData().add(new XYChart.Data(12, 5.9));
//Setting the name to the line (series)
series.setName("Rainfall In Hyderabad");
//Setting the data to Line chart
linechart.getData().add(series);
//Creating a stack pane to hold the chart
StackPane pane = new StackPane(linechart);
//Setting the Scene
Scene scene = new Scene(pane, 595, 350);
stage.setTitle("Line Chart");
stage.setScene(scene);
stage.show();
}
public static void main(String args[]){
launch(args);
}
}输出

更新于:2020年5月19日
429 次浏览

广告