
 数据结构
数据结构 网络
网络 RDBMS
RDBMS 操作系统
操作系统 Java
Java iOS
iOS HTML
HTML CSS
CSS Android
 Python
 C 编程
C 编程 C++
C++ C#
C# MongoDB
 MySQL
MySQL Javascript
 PHP
PHP如何在 JavaFX 折线图中将 X 轴移至顶部?
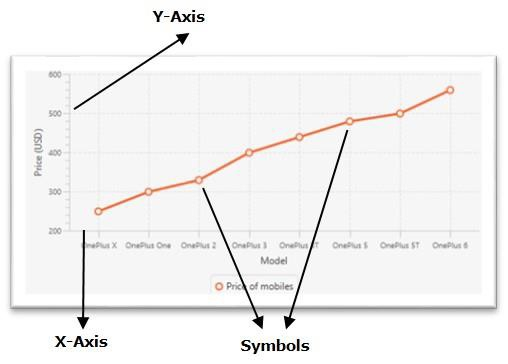
内联图表,其中数据值以一系列通过线连接的点表示。在 JavaFX 中,可以通过实例化 javafx.scene.chart.LineChart 类来创建折线图。
默认情况下,
JavaFX 折线图包含指示 X 轴上数据值中的符号。通常是小的圆圈。
图中的 X 轴在底部。
Y 轴在左侧。
将 X 轴移至顶部
Axis 类(所有轴的超类)有一个名为 side 的属性,它指定你需要当前轴在的绘图一侧(左、右、上、下)。可以使用 setSide() 方法为该属性设置值。此方法接受以下值之一作为参数 −
Side.BOTTOM
Side.TOP
Side.LEFT
Side.RIGHT
要将 X 轴移至顶部,请通过将 Side.TOP 值作为参数传入你的绘图的 X 轴对象的 setSide() 方法来调用该方法。
示例
import javafx.application.Application;
import javafx.geometry.Insets;
import javafx.geometry.Side;
import javafx.scene.Scene;
import javafx.stage.Stage;
import javafx.scene.chart.CategoryAxis;
import javafx.scene.chart.LineChart;
import javafx.scene.chart.NumberAxis;
import javafx.scene.chart.XYChart;
import javafx.scene.layout.StackPane;
public class LineChartAxisShift extends Application {
   public void start(Stage stage) {
      //Defining the x an y axes
      CategoryAxis xAxis = new CategoryAxis();
      NumberAxis yAxis = new NumberAxis();
      //Setting labels for the axes
      xAxis.setLabel("Months");
      yAxis.setLabel("Rainfall (mm)");
      //Creating a line chart
      LineChart linechart = new LineChart(xAxis, yAxis);
      //Preparing the data points for the line1
      XYChart.Series series = new XYChart.Series();
      series.getData().add(new XYChart.Data("Jul", 169.9));
      series.getData().add(new XYChart.Data("Aug", 178.7));
      series.getData().add(new XYChart.Data("Sep", 158.3));
      series.getData().add(new XYChart.Data("Oct", 97.2));
      series.getData().add(new XYChart.Data("Nov", 22.4));
      series.getData().add(new XYChart.Data("Dec", 5.9));
      //Setting the name to the line (series)
      series.setName("Rainfall In Hyderabad");
      //Setting the data to Line chart
      linechart.getData().add(series);
      //Shifting the X-axis
      xAxis.setSide(Side.TOP);
      //Creating a stack pane to hold the chart
      StackPane pane = new StackPane(linechart);
      pane.setPadding(new Insets(15, 15, 15, 15));
      pane.setStyle("-fx-background-color: BEIGE");
      //Setting the Scene
      Scene scene = new Scene(pane, 595, 350);
      stage.setTitle("Line Chart");
      stage.setScene(scene);
      stage.show();
   }
   public static void main(String args[]){
      launch(args);
   }
}
输出
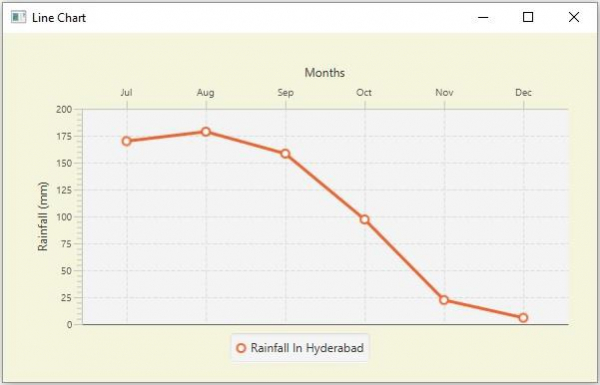

更新于: 2020 年 5 月 20 日
380 次浏览

广告