
 数据结构
数据结构 网络
网络 RDBMS
RDBMS 操作系统
操作系统 Java
Java iOS
iOS HTML
HTML CSS
CSS Android
 Python
 C编程
C编程 C++
C++ C#
C# MongoDB
 MySQL
MySQL Javascript
 PHP
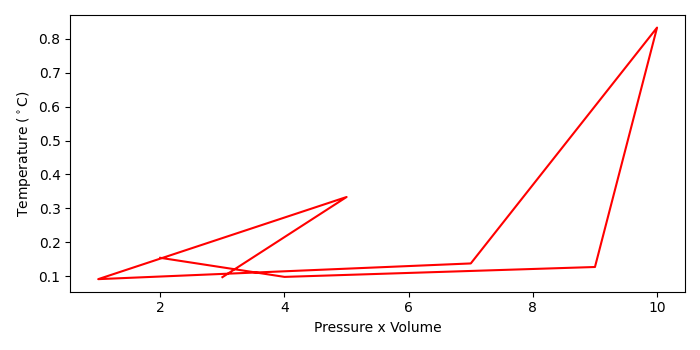
PHPMatplotlib – Python绘图中插入度数符号的方法?
要将度数符号插入绘图中,我们可以使用LaTeX表示法。
步骤
- 使用numpy创建pV、nR和T的数据点。
- 使用plot()方法绘出pV和T。
- 使用xlabel()方法为pV设置xlabel。
- 使用ylabel()方法为温度标签设置度数符号。
- 要显示该图像,请使用show()方法。
示例
import numpy as np
from matplotlib import pyplot as plt
plt.rcParams["figure.figsize"] = [7.00, 3.50]
plt.rcParams["figure.autolayout"] = True
pV = np.array([3, 5, 1, 7, 10, 9, 4, 2])
nR = np.array([31, 15, 11, 51, 12, 71, 41, 13])
T = np.divide(pV, nR)
plt.plot(pV, T, c="red")
plt.xlabel("Pressure x Volume")
plt.ylabel("Temperature ($^\circ$C)")
plt.show()
输出

更新时间: 2021年5月6日
10K+浏览

广告