
 数据结构
数据结构 网络
网络 关系数据库管理系统
 操作系统
操作系统 Java
Java iOS
iOS HTML
HTML CSS
CSS Android
 Python
 C 编程
C 编程 C++
C++ C#
C# MongoDB
 MySQL
MySQL Javascript
 PHP
PHP使用直方图分析图像的 OpenCV Python 程序
直方图是一种图形表示,显示图像中像素强度(范围从 0 到 255)是如何分布的。对于数字图像,直方图绘制像素强度与像素数量之间的图形。x 轴表示强度变化,y 轴表示特定强度下的像素数量。
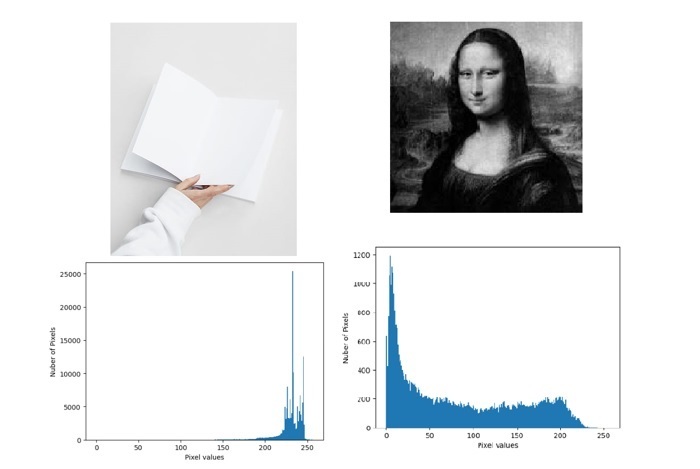
我们可以看到图像及其直方图。通过简单地查看图像的直方图,我们可以对该图像的对比度、亮度、强度分布等有一个基本的了解。
在本文中,我们将使用 OpenCV 模块编写一个 Python 程序,使用直方图来分析灰度图像和彩色图像。
cv2.calcHist() 函数
OpenCV 提供了一个 calcHist() 函数来计算一个或多个图像数组的直方图。以下是 calcHist() 函数的语法:
calcHist(images, channels, mask, histSize, ranges[, hist[, accumulate]])
参数
images:源图像。它应该用方括号给出,即 [image]。
channels:它指定要计算直方图的通道索引。如果图像是灰度图像,则其值为 [0];如果图像是彩色图像,则需要传递 [0]、[1] 或 [2] 来分别计算蓝色、绿色或红色通道的直方图。
mask:掩码图像。如果要查找图像特定区域的直方图,则必须为不需要的区域创建掩码。如果要查找整个图像的直方图,则为 None。
histSize:直方图大小的数组。
ranges:通常为 [0,256]。
示例
在本例中,我们将查找灰度模式下图像的直方图。
import matplotlib.pyplot as plt
import cv2

img = cv2.imread('Images/Dog.jpg')
histogram = cv2.calcHist([img],[0],None,[256],[0,256])

plt.xlabel("Pixel values")
plt.ylabel("Nuber of Pixels")
plt.plot(histogram)
plt.show()
输出

示例
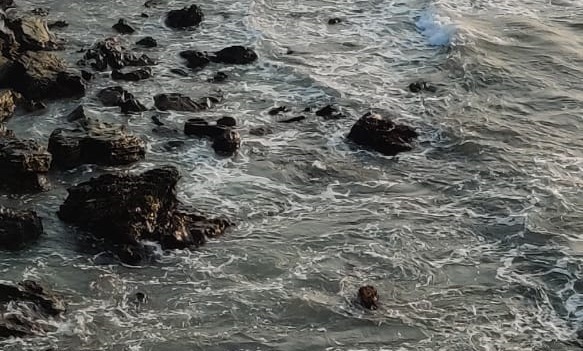
让我们查找彩色模式下图像的直方图。
import matplotlib.pyplot as plt
import cv2

image = cv2.imread('Images/Sky and Beach.jpg')
# split the image into its respective channels
channels = cv2.split(image)
colors = ("b", "g", "r")

plt.title("Color Histogram")
plt.xlabel("Pixel values")
plt.ylabel("Nuber of Pixels")

# loop over the image channels
for (chan, color) in zip(channels, colors):

   # create a histogram for the current channel and plot it
   hist = cv2.calcHist([chan], [0], None, [256], [0, 256])
   plt.plot(hist, color=color)
   plt.xlim([0, 256])
输入图像
输出图像
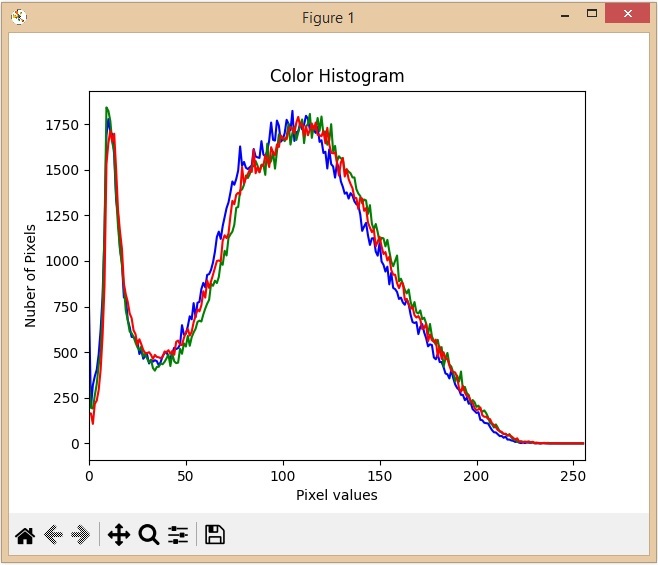
从上面的直方图中,我们可以观察到蓝色在图像中有一些高值区域。

更新于: 2023-05-31
548 次查看

广告