
 数据结构
数据结构 网络
网络 关系数据库管理系统
 操作系统
操作系统 Java
Java iOS
iOS HTML
HTML CSS
CSS Android
 Python
 C 编程
C 编程 C++
C++ C#
C# MongoDB
 MySQL
MySQL Javascript
 PHP
PHP在 Matplotlib 中绘制多个绘图
Python 提供了一个名为 Matplotlib 的强大库,该库以绘图和图形的形式创建视觉表示。该库的众多功能之一是能够在一个图形中绘制多个绘图,这在比较不同的数据集或可视化多个变量之间的关系时非常有用。我们将探索 Matplotlib 的名为“subplots()”的内置方法,该方法用于绘制多个绘图。
在 Matplotlib 中绘制多个绘图的 Python 程序
在直接跳到程序之前,让我们先熟悉一下 Matplotlib 的 subplots() 方法。
subplots() 方法
通过一次调用“subplots()”方法,我们可以在单个图形中创建一个或多个子图。它提供了对绘图的适当控制,并且还允许我们自定义其布局和外观。
语法
subplots(numOfrows, numOfcols)
这里,'numOfrows' 和 'numOfcols' 分别指定网格的行数和列数。
但是,我们也可以根据需要添加一些其他属性。
示例 1
在以下示例中,我们将绘制正弦和余弦函数的两个子图。
方法
首先,我们将导入 matplotlib 和 numpy。matplotlib 将用于可视化 numpy 生成的数据。
使用 NumPy 的内置方法“linspace()”生成一个从 0 到 10 之间 100 个等间距值的数组。然后,计算 x 数组中每个元素的正弦和余弦值,并将它们分别存储在 y1 和 y2 中。
现在,使用“subplots()”方法创建两个垂直排列的子图。此方法将返回一个名为“fig”的图形对象和一个子图轴“ax1”和“ax2”的元组。这里,“figsize”设置图形的大小。
在第一个子图 ax1 上绘制 x 值相对于 y1 值的图形。
同样,在第二个子图 ax2 上绘制 x 值相对于 y2 值的图形。
使用“tight_layout()”方法调整子图之间的间距,以防止重叠。
最后,显示绘图并退出。
import matplotlib.pyplot as plt
import numpy as np
# generating some random data for plotting
val = np.linspace(0, 10, 100)
pl1 = np.sin(val)
pl2 = np.cos(val)
# Creating subplots
fig, (axs1, axs2) = plt.subplots(2, 1, figsize = (6, 4))
# Plotting of the first subplot
axs1.plot(val, pl1, 'r', label = 'Sin')
axs1.set_xlabel('Axis-X')
axs1.set_ylabel('Axis-Y')
axs1.legend()
# Plotting of the second subplot
axs2.plot(val, pl2, 'b', label = 'Cos')
axs2.set_xlabel('Axis-X')
axs2.set_ylabel('Axis-Y')
axs2.legend()
# for adjusting the space between subplots
plt.tight_layout()
# to display the plots
plt.show()
输出

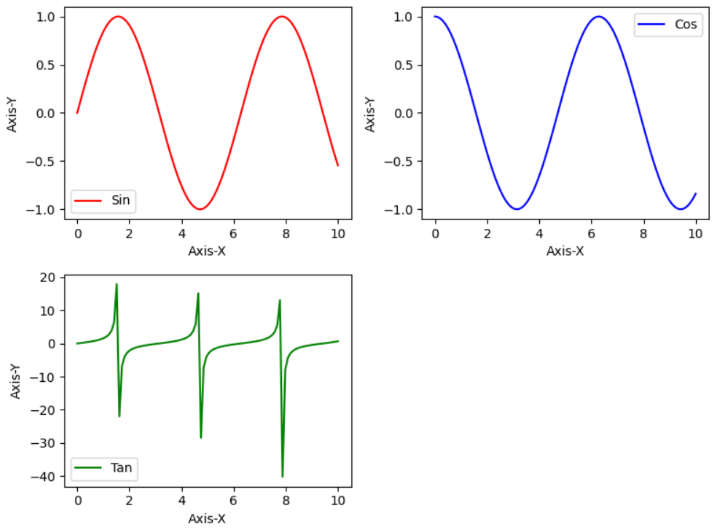
示例 2
在以下示例中,我们将更改先前示例的代码以添加一个正切函数的绘图。
import matplotlib.pyplot as plt
import numpy as np
# generating some random data for plotting
val = np.linspace(0, 10, 100)
pl1 = np.sin(val)
pl2 = np.cos(val)
pl3 = np.tan(val)
# Creating the subplots using above data
fig, axs = plt.subplots(2, 2, figsize = (8, 6))
# Plotting of the first subplot
axs[0, 0].plot(val, pl1, 'r', label = 'Sin')
axs[0, 0].set_xlabel('Axis-X')
axs[0, 0].set_ylabel('Axis-Y')
axs[0, 0].legend()
# To plot on the second subplot
axs[0, 1].plot(val, pl2, 'b', label = 'Cos')
axs[0, 1].set_xlabel('Axis-X')
axs[0, 1].set_ylabel('Axis-Y')
axs[0, 1].legend()
# Plotting of the third subplot
axs[1, 0].plot(val, pl3, 'g', label = 'Tan')
axs[1, 0].set_xlabel('Axis-X')
axs[1, 0].set_ylabel('Axis-Y')
axs[1, 0].legend()
# To remove the empty subplot
fig.delaxes(axs[1, 1])
# for adjusting the space between subplots
plt.tight_layout()
# Displaying all plots
plt.show()
输出
结论
我们从介绍 Matplotlib 及其内置方法“subplots()”开始本文。在下一节中,我们将详细解释此方法。此外,我们还讨论了两个示例程序以展示“subplots()”方法在绘制多个绘图中的用法。

3K+ 浏览量
