
 数据结构
数据结构 计算机网络
计算机网络 关系型数据库管理系统
 操作系统
操作系统 Java
Java iOS
iOS HTML
HTML CSS
CSS Android
 Python
 C 语言编程
 C++
C++ C#
C# MongoDB
 MySQL
MySQL JavaScript
 PHP
PHP如何使用 Matplotlib 绘制多条 graph?
若要在 matplotlib 中绘制多条 graph,我们将使用以下步骤 -
步骤
使用 numpy 创建x、y1和y2数据点。
在索引 1 处为当前图表添加子图。
使用x和y1绘制曲线 1。
在索引 2 处为当前图表添加子图。
使用x和y2绘制曲线 2。
如果要显示图形,请使用 show() 方法。
示例
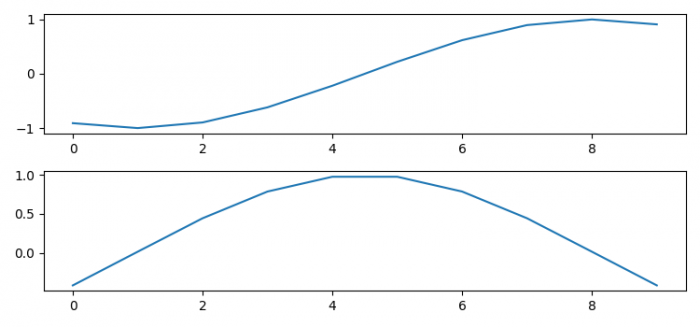
import numpy as np
from matplotlib import pyplot as plt
plt.rcParams["figure.figsize"] = [7.50, 3.50]
plt.rcParams["figure.autolayout"] = True
x = np.linspace(-2, 2, 10)
y1 = np.sin(x)
y2 = np.cos(x)
plt.subplot(211)
plt.plot(y1)
plt.subplot(212)
plt.plot(y2)
plt.show()
Explore our latest online courses and learn new skills at your own pace. Enroll and become a certified expert to boost your career.
输出

更新于:2023 年 10 月 22 日
21,000+ 浏览量

广告