
 数据结构
数据结构 网络
网络 关系型数据库管理系统
 操作系统
操作系统 Java
Java iOS
iOS HTML
HTML CSS
CSS Android
 Python
 C 编程
C 编程 C++
C++ C #
C # MongoDB
 MySQL
MySQL Javascript
 PHP
PHP如何在具有图例的 Matplotlib 中绘制来自多个两栏文本文件的数据?
要在具有图例的 Matplotlib 中绘制来自多个两栏文本文件的数据,我们可以执行以下步骤 -
从 pylab 导入genfromtxt 。它有几个选项可以从文本文件读取数据并绘制数据。
使用 genfromtxt 读取两个文本文件 test.txt和 test1.txt (有两栏数据),并将数据存储在两个变量 firstfiledata 和 secondfiledata 中。
使用plot()方法绘制数据。标签将显示为图例。
要显示图形,请使用 show() 方法。
示例
from matplotlib import pyplot as plt;
from pylab import genfromtxt;

plt.rcParams["figure.figsize"] = [7.00, 3.50]
plt.rcParams["figure.autolayout"] = True

firstfiledata = genfromtxt("test.txt");
secondfiledata = genfromtxt("test1.txt");
plt.plot(firstfiledata[:, 0], firstfiledata[:, 1], label="test.txt Data");
plt.plot(secondfiledata[:, 0], secondfiledata[:, 1], label="test1.txt Data");
plt.legend();
plt.show();
输出
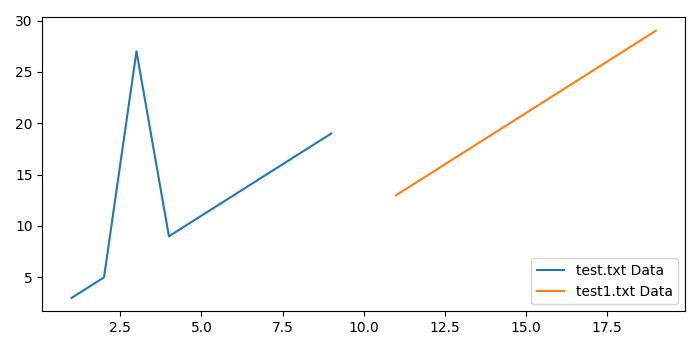
Suppse 这两个文本文件具有以下数据 -
test.txt
========
1    3
2    5
3    27
4    9
5    11
6    13
7    15
8    17
9    19
test1.txt
=========
11    13
12    15
13    17
14    19
15    21
16    23
17    25
18    27
19    29
当我们执行代码时,它将产生以下输出 -

更新于:2021 年 5 月 8 日
2K+ 浏览量

广告