
 数据结构
数据结构 网络
网络 RDBMS
RDBMS 操作系统
操作系统 Java
Java iOS
iOS HTML
HTML CSS
CSS Android
 Python
 C 编程
C 编程 C++
C++ C#
C# MongoDB
 MySQL
MySQL Javascript
 PHP
PHP如何从 Matplotlib 图表中提取数据?
如要从 Matplotlib 中的图表提取数据,我们可使用 get_xdata() 和 get_ydata() 方法。
步骤
- 设置图形大小并调整子图之间和周围的边距。
- 使用 numpy 创建 y 数据点。
- 使用 color=red 和 linewidth=5 绘制 y 数据点。
- 打印用于数据提取的语句。
- 使用 get_xdata() 和 get_ydata() 方法从图表提取数据(步骤 3)。
- 打印 x 和 y 数据(步骤 5)。
- 如要显示图表,请使用 show() 方法。
示例
import numpy as np
from matplotlib import pyplot as plt
plt.rcParams["figure.figsize"] = [7.50, 3.50]
plt.rcParams["figure.autolayout"] = True
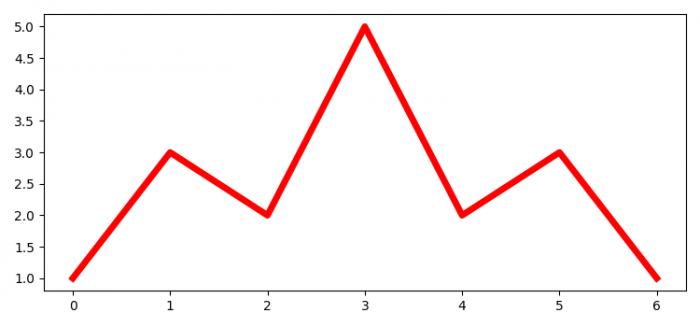
y = np.array([1, 3, 2, 5, 2, 3, 1])
curve, = plt.plot(y, c='red', lw=5)
print("Extracting data from plot....")
xdata = curve.get_xdata()
ydata = curve.get_ydata()
print("X data points for the plot is: ", xdata)
print("Y data points for the plot is: ", ydata)
plt.show()输出
Extracting data from plot....
X data points for the plot is: [0. 1. 2. 3. 4. 5. 6.]
Y data points for the plot is: [1 3 2 5 2 3 1]

更新于: 2021 年 6 月 1 日
14,000+ 次浏览

广告