
 数据结构
数据结构 网络
网络 RDBMS
RDBMS 操作系统
操作系统 Java
Java iOS
iOS HTML
HTML CSS
CSS 安卓
安卓 Python
 C 编程
C 编程 C++
C++ C#
C# MongoDB
 MySQL
MySQL Javascript
 PHP
PHP使用 matplotlib 绘制 .txt 文件数据
要使用 matplotlib 绘制 .txt 文件中的数据,我们可以采取以下步骤 −
- 设置图形大小并调整子图之间及周围的填充。
- 为 bar_names 和 bar_heights 初始化空列表。
- 以读取“r”模式的打开一个示例 .txt 文件,并附加到柱状图的名称和高度列表中。
- 绘制柱状图。
- 要显示图形,可以使用 show() 方法。
示例
from matplotlib import pyplot as plt
plt.rcParams["figure.figsize"] = [7.00, 3.50]
plt.rcParams["figure.autolayout"] = True
bar_names = []
bar_heights = []
for line in open("test_data.txt", "r"):
bar_name, bar_height = line.split()
bar_names.append(bar_name)
bar_heights.append(bar_height)
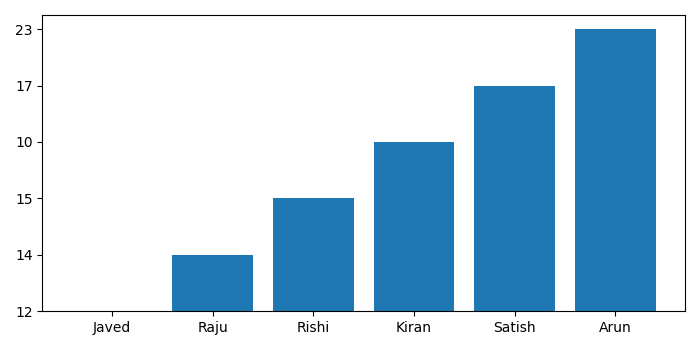
plt.bar(bar_names, bar_heights)
plt.show()“test_data.txt”包含以下数据 −
Javed  12
Raju   14
Rishi  15
Kiran  10
Satish 17
Arun   23
输出
会生成以下输出


更新于: 21-Sep-2021
4K+ 浏览量

广告