
 数据结构
数据结构 网络技术
网络技术 关系型数据库管理系统
 操作系统
操作系统 Java
Java iOS
iOS HTML
HTML CSS
CSS Android
 Python
 C 程序设计
 C++
C++ C#
C# MongoDB
 MySQL
MySQL Javascript
 PHP
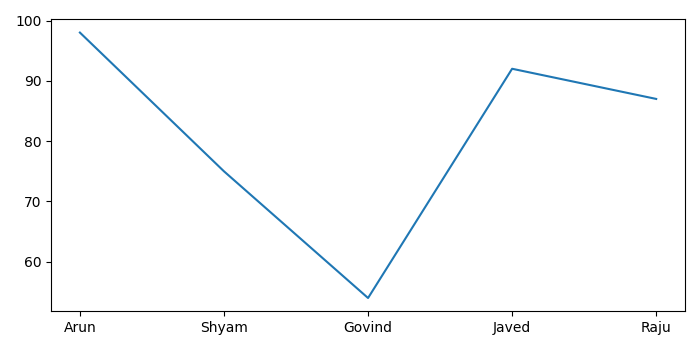
PHP利用 Matplotlib 绘制 CSV 文件中的数据
要将 CSV 文件的特定列提取到 Python 中的列表中,我们可以使用 Pandas read_csv() 方法。
步骤
- 列出需要提取的列。
- 使用 read_csv() 方法将 CSV 文件数据提取到数据框中。
- 打印提取的数据。
- 使用 plot() 方法绘制数据框。
- 要显示图形,请使用 show() 方法。
示例
import pandas as pd
from matplotlib import pyplot as plt
plt.rcParams["figure.figsize"] = [7.00, 3.50]
plt.rcParams["figure.autolayout"] = True
columns = ["Name", "Marks"]
df = pd.read_csv("input.csv", usecols=columns)
print("Contents in csv file:
", df)
plt.plot(df.Name, df.Marks)
plt.show()
输出

更新于: 09-Sep-2023
浏览量超过 4.7 万

广告