Angular Google 图表 - 表格图表
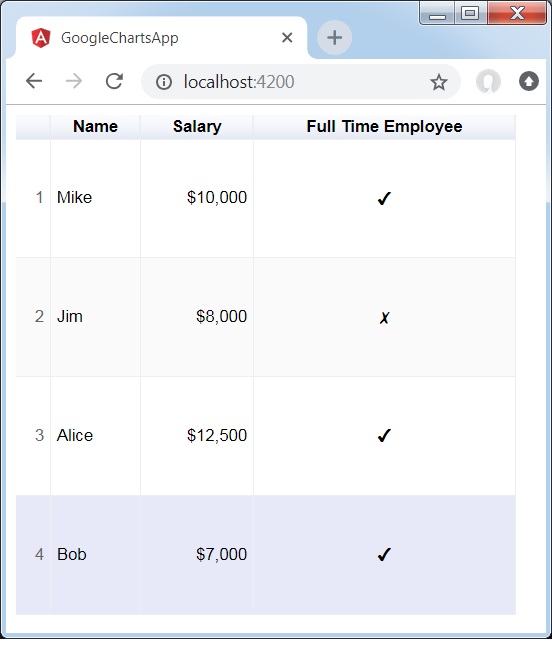
表格图表有助于呈现可排序可分页的表格。表格单元格可以使用格式字符串进行格式化,或直接插入 HTML 作为单元格值。数值默认右对齐;布尔值显示为对勾或叉号。用户可以使用键盘或鼠标选择单行。列标题可用于排序。在滚动期间,标题行保持固定。该表格触发与用户交互相对应的事件。
我们在“Google 图表配置语法”章节中已经看到了用于绘制图表的配置。现在,我们来看一个表格图表的示例。
配置
我们使用了 Table 类来显示表格图表。
type = 'Table';
示例
app.component.ts
import { Component } from '@angular/core';
@Component({
   selector: 'app-root',
   templateUrl: './app.component.html',
   styleUrls: ['./app.component.css']
})
export class AppComponent {
   title = "";
   type = 'Table';
   data = [
      ['Mike',  {v: 10000, f: '$10,000'}, true],
      ['Jim',   {v:8000,   f: '$8,000'},  false],
      ['Alice', {v: 12500, f: '$12,500'}, true],
      ['Bob',   {v: 7000,  f: '$7,000'},  true]
   ];
   columnNames = ["Name", "Salary","Full Time Employee"];
   options = {
     alternatingRowStyle:true,
     showRowNumber:true
   };
   width = 550;
   height = 400;
}
结果
验证结果。
广告