- Angular Highcharts 教程
- Angular Highcharts - 主页
- Angular Highcharts - 概述
- 环境设置
- 配置语法
- Angular Highcharts - 折线图
- Angular Highcharts - 面积图
- Angular Highcharts - 条形图
- Angular Highcharts - 柱状图
- Angular Highcharts - 饼图
- Angular Highcharts - 散点图
- Angular Highcharts - 动态图表
- Angular Highcharts - 组合
- Angular Highcharts - 3D 图表
- Angular Highcharts - 地图图表
- Angular Highcharts 资源
- Angular Highcharts - 快速指南
- Angular Highcharts - 资源
- Angular Highcharts - 讨论
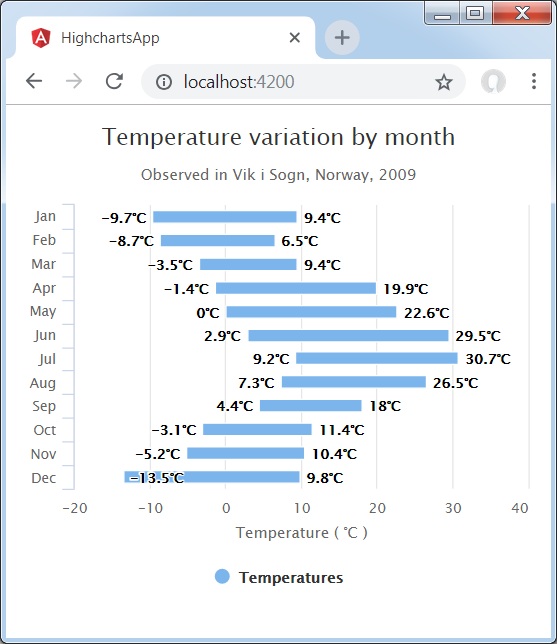
Angular Highcharts - 柱状范围
以下是一个使用范围的柱状图示例。
我们已经看过在 Highcharts 配置语法 章节中用来绘制图表的配置。
以下给出了使用范围的柱状图示例。
配置
让我们现在看看其他配置。
chart
将图表类型配置为基于“columnrange”。chart.type 决定图表序列的类型。默认值为“line”。
var chart = {
   type: 'columnrange',
   inverted: true
};
示例
app.component.ts
import { Component } from '@angular/core';
import * as Highcharts from 'highcharts';
import addMore from "highcharts/highcharts-more";
addMore(Highcharts)
@Component({
   selector: 'app-root',
   templateUrl: './app.component.html',
   styleUrls: ['./app.component.css']
})
export class AppComponent {
   highcharts = Highcharts;
   chartOptions = {
      chart : {
         type: 'columnrange',
         inverted:true
      },
      title : {
         text: 'Temperature variation by month'
      },
      subtitle : {
         text: 'Observed in Vik i Sogn, Norway, 2009'
      },
      xAxis : {
         categories: ['Jan','Feb','Mar','Apr','May','Jun','Jul','Aug','Sep','Oct','Nov','Dec']
      },
      yAxis : {
         title: {
            text: 'Temperature ( \xB0C )'
         }
      },
      tooltip: {
         headerFormat: '<span style = "font-size:10px">{point.key}</span><table>',
            pointFormat: '<tr><td style = "color:{series.color};padding:0">{series.name}: </td>' +
            '<td style = "padding:0"><b>{point.y:.1f} mm</b></td></tr>',
            footerFormat: '</table>',
         shared: true,
         useHTML: true
      },
      plotOptions : {
         columnrange: {
            dataLabels: {
               enabled: true,
               formatter: function () {
                  return this.y + '\xB0C';
               }
            }
         }
      },
      credits : {
         enabled: false
      },
      series : [{
         name: 'Temperatures',
         data: [
            [-9.7, 9.4],
            [-8.7, 6.5],
            [-3.5, 9.4],
            [-1.4, 19.9],
            [0.0, 22.6],
            [2.9, 29.5],
            [9.2, 30.7],
            [7.3, 26.5],
            [4.4, 18.0],
            [-3.1, 11.4],
            [-5.2, 10.4],
            [-13.5, 9.8]
         ]
      }]
   };
}
结果
验证结果。
angular_highcharts_column_charts.htm
广告