- Angular Highcharts 教程
- Angular Highcharts - 主页
- Angular Highcharts - 概述
- 环境设置
- 配置语法
- Angular Highcharts - 折线图
- Angular Highcharts - 面积图
- Angular Highcharts - 条形图
- Angular Highcharts - 柱状图
- Angular Highcharts - 饼图
- Angular Highcharts - 散点图
- Angular Highcharts - 动态图表
- Angular Highcharts - 组合
- Angular Highcharts - 3D 图表
- Angular Highcharts - 地图图表
- Angular Highcharts 资源
- Angular Highcharts - 快速指南
- Angular Highcharts - 资源
- Angular Highcharts - 讨论
Angular Highcharts - 热力图图表
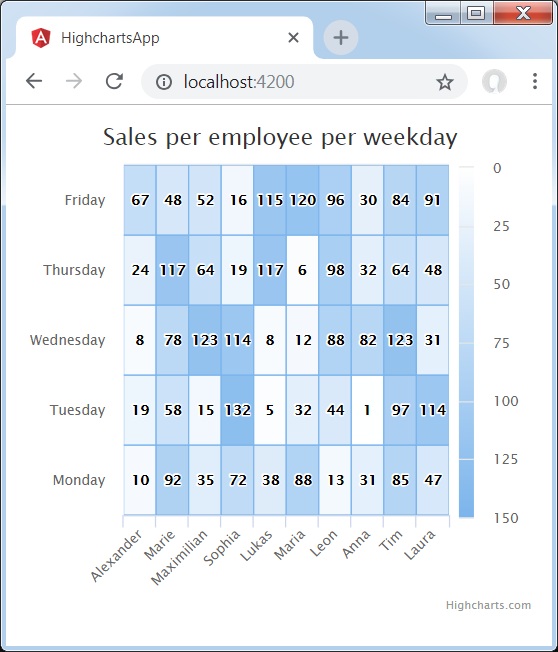
以下是热力图图表示例。
我们在 Highcharts 配置语法 章节中已经了解了用于绘制图表所使用的配置。
下面给出了热力图图表示例。
配置
现在让我们了解采取了哪些其他配置/步骤。
chart
将图表类型配置为“heatmap”。chart.type 决定了图表的系列类型。在此处,默认值是“line”。
chart : {
   type: 'heatmap',
   marginTop: 40,
   marginBottom: 80
},
示例
app.component.ts
import { Component } from '@angular/core';
import * as Highcharts from 'highcharts';
import * as highchartsHeatmap from 'highcharts/modules/heatmap';
highchartsHeatmap(Highcharts);
@Component({
  selector: 'app-root',
  templateUrl: './app.component.html',
  styleUrls: ['./app.component.css']
})
export class AppComponent {
   highcharts = Highcharts;
   chartOptions = {
      chart : {
         type: 'heatmap',
         marginTop: 40,
         marginBottom: 80
      },
      title : {
         text: 'Sales per employee per weekday'
      },
      xAxis : {
         categories: ['Alexander', 'Marie', 'Maximilian', 'Sophia', 'Lukas',
            'Maria', 'Leon', 'Anna', 'Tim', 'Laura']
      },
      yAxis : {
         categories: ['Monday', 'Tuesday', 'Wednesday', 'Thursday', 'Friday'],
            title: null
      },
      colorAxis : {
         min: 0,
         minColor: '#FFFFFF',
         maxColor: Highcharts.getOptions().colors[0]
      },
      legend : {
         align: 'right',
         layout: 'vertical',
         margin: 0,
         verticalAlign: 'top',
         y: 25,
         symbolHeight: 280
      },
      tooltip : {
         formatter: function () {
            return '<b>' + this.series.xAxis.categories[this.point.x] +
               '</b> sold <br><b>' +
               this.point.value +
               '</b> items on <br><b>' +
               this.series.yAxis.categories[this.point.y] + '</b>';
         }
      },
      series : [{
         name: 'Sales per employee',
         borderWidth: 1,
         data: [[0, 0, 10], [0, 1, 19], [0, 2, 8], [0, 3, 24], [0, 4, 67],
         [1, 0, 92], [1, 1, 58], [1, 2, 78], [1, 3, 117], [1, 4, 48],
         [2, 0, 35], [2, 1, 15], [2, 2, 123], [2, 3, 64], [2, 4, 52],
         [3, 0, 72], [3, 1, 132], [3, 2, 114], [3, 3, 19], [3, 4, 16],
         [4, 0, 38], [4, 1, 5], [4, 2, 8], [4, 3, 117], [4, 4, 115],
         [5, 0, 88], [5, 1, 32], [5, 2, 12], [5, 3, 6], [5, 4, 120],
         [6, 0, 13], [6, 1, 44], [6, 2, 88], [6, 3, 98], [6, 4, 96],
         [7, 0, 31], [7, 1, 1], [7, 2, 82], [7, 3, 32], [7, 4, 30],
         [8, 0, 85], [8, 1, 97], [8, 2, 123], [8, 3, 64], [8, 4, 84],
         [9, 0, 47], [9, 1, 114], [9, 2, 31], [9, 3, 48], [9, 4, 91]],

         dataLabels: {
            enabled: true,
            color: '#000000'
         }
      }]

   };
}
结果
验证结果。

angular_highcharts_map_charts.htm
广告