- Apache Bench 教程
- Apache Bench - 首页
- Apache Bench - 概述
- Apache Bench - 环境设置
- 测试我们的示例应用程序
- 并发测试多个 URL
- 动态页面测试准备
- 动态页面的顺序测试用例
- 输出结果比较
- Apache Bench 有用资源
- Apache Bench - 快速指南
- Apache Bench - 有用资源
- Apache Bench - 讨论
Apache Bench - 快速指南
Apache Bench - 概述
性能测试已被证明对业务成功至关重要。糟糕的网站性能不仅会导致经济损失,有时还会导致法律后果。
在重要的在线互动中,例如购物、在线考试、账单支付等,没有人愿意忍受缓慢且不可靠的网站。随着互联网的广泛普及,替代方案的数量非常庞大。失去客户比获得客户更容易,而性能是关键的变革因素。
负载测试工具的必要性
如果我们能理解负载测试工具的必要性,它将给我们使用它的理由和动力。一些著名的商业网站在访问量激增时遭受了严重的停机。电子商务网站在广告活动上投入巨资,但在负载测试上却很少投入。因此,当这些营销活动带来流量时,他们无法确保最佳的系统性能。
另一个忽略负载测试的常见例子是 WordPress 网站中出现的“建立连接错误”。因此,在将网站或应用程序部署到生产环境之前,对其进行负载测试是一个好主意。在进行更详细的测试之前,快速建立项目的最佳情况场景会很好。
什么是 Apache Bench?
Apache Bench (ab) 是 Apache 组织提供的一个用于对超文本传输协议 (HTTP) web 服务器进行基准测试的工具。虽然它旨在衡量 Apache web 服务器的性能,但它也可以用于测试任何其他同样优秀的 web 服务器。使用此工具,您可以快速了解您的 web 服务器能够处理每秒多少个请求。
Apache Bench 的特性
让我们看看 Apache Bench 的重要特性和限制。特性和限制如下所示:
作为开源软件,它是免费提供的。
它是一个简单的命令行计算机程序。
它是一个平台无关的工具。这意味着它可以在 Linux/Unix 或 Windows 服务器上同样有效地调用。
它只能对 web 服务器(HTTP 或 HTTPS)进行负载和性能测试。
它不可扩展。
Apache Bench 无论并发级别(由 -c 标志指定)如何,都只使用一个操作系统线程。因此,在对高容量服务器进行基准测试时,Apache Bench 的单个实例本身可能成为瓶颈。要完全饱和目标 URL,如果您的服务器有多个处理器核心,最好并行使用 Apache Bench 的其他实例。
注意事项
您需要注意的是,在 Apache Bench 中没有指令可以在运行测试时以特定间隔增加并发性。因此,使用 ab 运行负载测试等同于拒绝服务 (DOS) 攻击。如果您要长时间进行大量的负载测试,建议您告知并事先获得您的 VPS 服务提供商的许可。他们会为您分配合适的时间间隔或将您的节点转移到负载测试任务上。
其次,如果您只是为了学习 Apache Bench 而持续且长时间地测试第三方的网站(您的 VPS 成为测试节点),则存在您的 VPS 公共 IP 被第三方网站永久阻止的可能性。在这种情况下,您将无法使用相同的 IP 连接到该网站。但是,如果您确实希望将来连接到该网站,唯一的解决方案是与目标网站的系统管理员联系,或在 VPS 服务提供商的帮助下创建具有不同 IP 的服务器的新实例。
在警告您之后,请让我向您保证,本教程中的所有测试都足够安全,并且不属于系统管理员通常所说的“系统滥用”行为。
Apache Bench - 环境设置
在本章中,我们将指导您如何在您的 VPS 上为 Apache Bench 设置环境。
系统要求
内存 - 128 MB
磁盘空间 - 没有最低要求
操作系统 - 没有最低要求
安装 Apache Bench
Apache Bench 是一个独立的应用程序,不依赖于 Apache web 服务器的安装。以下是安装 Apache Bench 的两步过程。
步骤 1 - 更新软件包数据库。
# apt-get update
请注意,终端命令之前的符号 # 表示 root 用户正在发出该命令。
步骤 2 - 安装 apache2 utils 软件包以访问 Apache Bench。
# apt-get install apache2-utils
Apache Bench 现在已安装。如果您想测试托管在同一 VPS 上的 web 应用程序,那么只需安装 Apache web 服务器即可:
# apt-get install apache2
作为 Apache 实用程序,Apache Bench 会在安装 Apache web 服务器时自动安装。
验证 Apache Bench 安装
现在让我们看看如何验证 Apache Bench 的安装。以下代码将帮助您验证安装:
# ab -V
输出
This is ApacheBench, Version 2.3 <$Revision: 1604373 $>
Copyright 1996 Adam Twiss, Zeus Technology Ltd, http://www.zeustech.net/
Licensed to The Apache Software Foundation, https://apache.org/
当您看到上述终端输出时,表示您已成功安装 Apache Bench。
创建特权 Sudo 用户
从安全角度来看,对于系统管理员来说,创建 sudo 用户而不是以 root 用户身份工作被认为是一种良好的实践。我们将创建一个名为 test 的测试用户,用于此目的:
# useradd -m -d /home/test -g sudo test
让我们为新用户设置密码:
# passwd test
系统将提示您为用户 test 输入新密码。您可以输入一个简单的密码,因为我们只是在测试,而不是部署到生产服务器。通常,sudo 命令会提示您提供 sudo 用户密码;建议不要使用复杂密码,因为此过程会变得麻烦。
输出
Enter new UNIX password:
Retype new UNIX password:
passwd: password updated successfully
测试 Apache.org 网站
在本节中,我们将测试 Apache.org 网站。让我们首先切换到 sudo 用户 test:
# su test
首先,我们将测试 Apache 组织的网站,https://apache.org/。我们将首先运行命令,然后理解输出:
$ ab -n 100 -c 10 https://apache.org/
这里-n是为基准测试会话执行的请求数。默认情况下只执行单个请求,这通常会导致基准测试结果不具有代表性。
而-c是并发性,表示一次执行多个请求的数量。默认情况下一次一个请求。
因此,在此测试中,Apache Bench 将以 10 的并发性向 Apache 组织服务器发出 100 个请求。
输出
This is ApacheBench, Version 2.3 <$Revision: 1604373 $>
Copyright 1996 Adam Twiss, Zeus Technology Ltd, http://www.zeustech.net/
Licensed to The Apache Software Foundation, https://apache.org/

Benchmarking www.apache.org (be patient).....done

Server Software:        Apache/2.4.7
Server Hostname:        www.apache.org
Server Port:            443
SSL/TLS Protocol:       TLSv1.2,ECDHE-RSA-AES256-GCM-SHA384,2048,256

Document Path:          /
Document Length:        58769 bytes

Concurrency Level:      10
Time taken for tests:   1.004 seconds
Complete requests:      100
Failed requests:        0
Total transferred:      5911100 bytes
HTML transferred:       5876900 bytes
Requests per second:    99.56 [#/sec] (mean)
Time per request:       100.444 [ms] (mean)
Time per request:       10.044 [ms] (mean, across all concurrent requests)
Transfer rate:          5747.06 [Kbytes/sec] received

Connection Times (ms)
              min  mean[+/-sd] median   max
Connect:       39   46  30.9     41     263
Processing:    37   40  21.7     38     255
Waiting:       12   15  21.7     13     230
Total:         77   86  37.5     79     301

Percentage of the requests served within a certain time (ms)
  50%     79
  66%     79
  75%     80
  80%     80
  90%     82
  95%     84
  98%    296
  99%    301
 100%    301 (longest request)
运行我们的第一个测试后,很容易识别此命令的使用模式,如下所示:
# ab [options .....] URL
其中,
ab - Apache Bench 命令
options - 我们要执行的特定任务的标志
URL - 我们要测试的路径 URL
理解输出值
我们需要理解不同的指标来理解 ab 返回的各种输出值。以下是列表:
服务器软件 - 这是在第一个成功返回的 HTTP 标头中返回的 web 服务器名称。
服务器主机名 - 这是命令行上给定的 DNS 或 IP 地址。
服务器端口 - 这是 ab 连接到的端口。如果命令行上没有给出端口,则默认为 http 的 80 和 https 的 443。
SSL/TLS 协议 - 这是客户端和服务器之间协商的协议参数。只有在使用 SSL 时才会打印此内容。
文档路径 - 这是从命令行字符串解析的请求 URI。
文档长度 - 这是第一个成功返回的文档的大小(以字节为单位)。如果文档长度在测试期间发生变化,则响应被视为错误。
并发级别 - 这是测试期间使用的并发客户端(相当于 web 浏览器)的数量。
测试花费的时间 - 这是从创建第一个套接字连接到接收最后一个响应所花费的时间。
完成的请求 - 收到的成功响应的数量。
失败的请求 - 被视为失败的请求数量。如果此数字大于零,则会打印另一行,显示由于连接、读取、内容长度不正确或异常而失败的请求数量。
总传输量 - 从服务器接收到的字节总数。此数字本质上是从网络上传输的字节数。
HTML 传输量 - 从服务器接收到的文档字节总数。此数字不包括在 HTTP 标头中接收到的字节。
每秒请求数 - 这是每秒的请求数。此值是将请求数除以总花费时间的结果。
每个请求的时间 - 平均每个请求花费的时间。第一个值是使用公式并发性 * 时间 * 1000 / 完成计算,而第二个值是使用公式时间 * 1000 / 完成计算。
传输速率 - 使用公式总读取 / 1024 / 时间计算的传输速率。
负载测试输出的快速分析
在了解了 ab 命令输出值的标题后,让我们尝试分析和理解我们初始测试的输出值:
Apache 组织正在使用他们自己的 Web 服务器软件 - Apache(版本 2.4.7)
由于 https,服务器正在端口 443 上监听。如果是 http,它将是 80(默认)。
100 个请求总共传输了 58769 字节数据。
测试在 1.004 秒内完成。没有失败的请求。
每秒请求数 - 99.56。这被认为是一个相当不错的数字。
每个请求的时间 - 100.444 毫秒(对于 10 个并发请求)。因此,在所有请求中,它是 100.444 毫秒 / 10 = 10.044 毫秒。
传输速率 - 接收到的 1338.39 [千字节/秒]。
在连接时间统计中,您可以观察到许多请求必须等待几秒钟。这可能是由于 apache web 服务器将请求放入等待队列。
在我们的第一个测试中,我们测试了一个托管在不同服务器上的应用程序(即 www.apache.org)。在本教程的后面部分,我们将测试托管在与运行 ab 测试相同的服务器上的示例 web 应用程序。这是为了便于学习和演示。理想情况下,主机节点和测试节点应该不同,以便进行准确的测量。
为了更好地学习 ab,您应该比较和观察输出值在不同情况下如何变化,因为我们将在本教程中继续学习。
绘制 Apache Bench 的输出
这里我们将绘制相关的结果,以查看服务器在请求数量增加时需要花费多少时间。为此,我们将在之前的命令中添加-g选项,后跟文件名(这里为out.data),其中将保存ab输出数据:
$ ab -n 100 -c 10 -g out.data https://apache.org/
现在让我们在创建图表之前查看out.data:
$ less out.data
输出
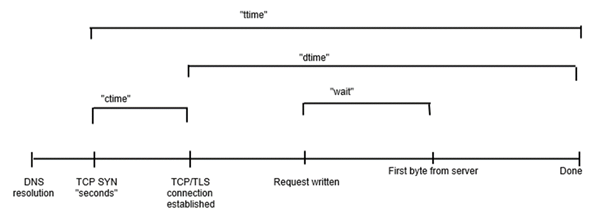
starttime       seconds ctime   dtime   ttime   wait
Tue May 30 12:11:37 2017        1496160697      40      38      77      13
Tue May 30 12:11:37 2017        1496160697      42      38      79      13
Tue May 30 12:11:37 2017        1496160697      41      38      80      13
...
现在让我们了解out.data文件中的列标题:
starttime - 这是调用开始的日期和时间。
seconds - 与starttime相同,但使用Unix时间戳格式(date -d @1496160697返回starttime输出)。
ctime - 这是连接时间。
dtime - 这是处理时间。
ttime - 这是总时间(它是ctime和dtime的总和,在数学上ttime = ctime + dtime)。
wait - 这是等待时间。
要直观地了解这些多个项目之间是如何相互关联的,请查看以下图片:
如果我们在终端或图形不可用的环境中工作,gnuplot是一个不错的选择。我们将通过以下步骤快速了解它。
让我们安装并启动gnuplot:
$ sudo apt-get install gnuplot
$ gnuplot
输出
G N U P L O T
Version 4.6 patchlevel 6    last modified September 2014
Build System: Linux x86_64

Copyright (C) 1986-1993, 1998, 2004, 2007-2014
Thomas Williams, Colin Kelley and many others

gnuplot home:     http://www.gnuplot.info
faq, bugs, etc:   type "help FAQ"
immediate help:   type "help"  (plot window: hit 'h')

Terminal type set to 'qt'
gnuplot>
由于我们正在终端上工作,并且假设图形不可用,我们可以选择哑终端,它将在终端本身输出ASCII字符。这有助于我们了解此快速工具的绘图效果。现在让我们准备终端以进行ASCII绘图。
gnuplot> set terminal dumb
输出
Terminal type set to 'dumb'
Options are 'feed  size 79, 24'
现在,我们的gnuplot终端已准备好进行ASCII绘图,让我们绘制out.data文件中的数据:
gnuplot> plot "out.data" using 9 w l
输出
  1400 ++-----+------+-----+------+------+------+------+-----+------+-----++
       +      +      +     +      +      +      +"out.data" using 9 ****** +
       |                                                                   |
  1200 ++                       ********************************************
       |     *******************                                           |
  1000 ++    *                                                            ++
       |     *                                                             |
       |     *                                                             |
   800 ++   *                                                             ++
       |    *                                                              |
       |    *                                                              |
   600 ++   *                                                             ++
       |    *                                                              |
       |    *                                                              |
   400 ++   *                                                             ++
       |    *                                                              |
   200 ++   *                                                             ++
       |    *                                                              |
       +****  +      +     +      +      +      +      +     +      +      +
     0 ++-----+------+-----+------+------+------+------+-----+------+-----++
       0      10     20    30     40     50     60     70    80     90    100
我们绘制了ttime,即第9列中的总时间(以毫秒为单位),相对于请求数量。我们可以注意到,对于最初的十个请求,总时间接近100毫秒,对于接下来的30个请求(从第10个到第40个),它增加到1100毫秒,依此类推。您的图表根据您的out.data可能会有所不同。
测试我们的示例应用程序
在上一章中,我们了解了Apache Bench测试第三方网站的基本用法。在本节中,我们将使用此工具测试我们自己的服务器上的Web应用程序。为了使教程尽可能地自包含,我们选择安装一个Python应用程序进行演示;您可以根据自己的专业水平选择其他语言,如PHP或Ruby。
安装Python
通常,Python在Linux服务器上默认安装。
安装Bottle框架并创建简单的应用程序
Bottle是一个用Python编写的微框架,用于创建Web应用程序,pip是Python包管理器。在终端中键入以下命令以安装Bottle:
$ sudo apt-get install python-pip
$ sudo pip install bottle
现在让我们创建一个小的Bottle应用程序。为此,创建一个目录并进入其中:
$ mkdir webapp
$ cd webapp
我们将在webapp目录中创建一个新的Python脚本app.py:
$ vim app.py
现在,在app.py文件中编写以下代码:
from bottle import Bottle, run

app = Bottle()

@app.route('/')
@app.route('/hello')
def hello():
   return "Hello World!"

run(app, host = 'localhost', port = 8080)
添加上述行后,保存并关闭文件。保存文件后,我们可以运行Python脚本以启动应用程序:
$ python app.py
输出
Bottle v0.12.7 server starting up (using WSGIRefServer())...
Listening on https://:8080/
Hit Ctrl-C to quit.
此输出表明我们的应用程序正在本地机器上的主机https://上运行,并在端口8080上监听。
让我们检查我们的应用程序是否正确响应HTTP请求。由于此终端在不退出Bottle应用程序服务的情况下无法接收任何输入,因此我们需要使用另一个终端登录到我们的VPS。使用另一个终端登录到VPS后,您可以通过在新的终端中键入以下代码来导航到您的应用程序。
$ lynx https://:8080/
Lynx是一个命令行浏览器,通常在各种Linux发行版(如Debian和Ubuntu)中默认安装。如果您看到以下输出,则表示您的应用程序运行正常。
输出
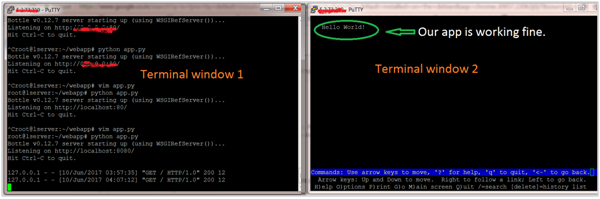
如果您看到以上输出,则表示我们的应用程序已上线并准备进行测试。
使用开发Web服务器测试应用程序
请注意,ab中存在一个错误,它无法测试localhost上的应用程序。因此,我们将在app.py文件中将主机从localhost更改为127.0.0.1。因此,文件将更改为以下内容:
from bottle import Bottle, run

app = Bottle()

@app.route('/')
@app.route('/hello')
def hello():
   return "Hello World!"

run(app, host = '127.0.0.1', port = 8080)
现在让我们通过在运行lynx命令的同一终端上键入以下命令来测试我们的应用程序:
$ ab -n 100 -c 10 http://127.0.0.1:8080/hello
输出
This is ApacheBench, Version 2.3 <$Revision: 1604373 $>
Copyright 1996 Adam Twiss, Zeus Technology Ltd, http://www.zeustech.net/
Licensed to The Apache Software Foundation, https://apache.org/

Benchmarking 127.0.0.1 (be patient).....done


Server Software:        WSGIServer/0.1
Server Hostname:        127.0.0.1
Server Port:            8080

Document Path:          /hello
Document Length:        12 bytes

Concurrency Level:      10
Time taken for tests:   0.203 seconds
Complete requests:      100
Failed requests:        0
Total transferred:      16500 bytes
HTML transferred:       1200 bytes
Requests per second:    493.78 [#/sec] (mean)
Time per request:       20.252 [ms] (mean)
Time per request:       2.025 [ms] (mean, across all concurrent requests)
Transfer rate:          79.56 [Kbytes/sec] received

Connection Times (ms)
              min  mean[+/-sd] median   max
Connect:        0    0   0.1      0       0
Processing:     1    6  28.2      2     202
Waiting:        1    6  28.2      2     202
Total:          1    6  28.2      2     202

Percentage of the requests served within a certain time (ms)
  50%      2
  66%      2
  75%      2
  80%      2
  90%      2
  95%      2
  98%    202
  99%    202
 100%    202 (longest request)
而第一个终端上的输出将是(100次)如下:
...
127.0.0.1 - - [10/Jun/2017 04:30:26] "GET /hello HTTP/1.0" 200 12
127.0.0.1 - - [10/Jun/2017 04:30:26] "GET /hello HTTP/1.0" 200 12
127.0.0.1 - - [10/Jun/2017 04:30:26] "GET /hello HTTP/1.0" 200 12
...
您可以观察到与初始测试相比,ab结果的各种值是如何变化的。
使用多线程Web服务器测试应用程序
在ab的先前测试中,我们使用了Bottle框架中捆绑的默认Web服务器。
现在,我们将使用多线程Web服务器替换单线程默认Web服务器。因此,让我们安装一个多线程Web服务器库,如cherrypy或gunicorn,并告诉Bottle使用它。我们在这里选择了gunicorn进行演示(您也可以选择其他一些):
$ sudo apt-get install gunicorn
并修改文件,即从默认Web服务器更改为gunicorn:
...
run(server = 'gunicorn'...)
...
让我们在第二个终端中测试应用程序。
$ ab -n 100 -c 10 http://127.0.0.1:8080/hello
输出
This is ApacheBench, Version 2.3 <$Revision: 1604373 $>
Copyright 1996 Adam Twiss, Zeus Technology Ltd, http://www.zeustech.net/
Licensed to The Apache Software Foundation, https://apache.org/

Benchmarking 127.0.0.1 (be patient).....done


Server Software:        gunicorn/19.0.0
Server Hostname:        127.0.0.1
Server Port:            8080

Document Path:          /hello
Document Length:        12 bytes

Concurrency Level:      10
Time taken for tests:   0.031 seconds
Complete requests:      100
Failed requests:        0
Total transferred:      17200 bytes
HTML transferred:       1200 bytes
Requests per second:    3252.77 [#/sec] (mean)
Time per request:       3.074 [ms] (mean)
Time per request:       0.307 [ms] (mean, across all concurrent requests)
Transfer rate:          546.36 [Kbytes/sec] received

Connection Times (ms)
              min  mean[+/-sd] median   max
Connect:        0    1   0.9      0       4
Processing:     1    2   0.7      3       4
Waiting:        0    2   0.8      2       3
Total:          2    3   0.6      3       5
WARNING: The median and mean for the initial connection time are not within a normal
        deviation These results are probably not that reliable.
WARNING: The median and mean for the processing time are not within a normal deviation
        These results are probably not that reliable.

Percentage of the requests served within a certain time (ms)
  50%      3
  66%      3
  75%      3
  80%      3
  90%      4
  95%      5
  98%      5
  99%      5
 100%      5 (longest request)
观察每秒请求数如何从493增加到3252。这意味着gunicorn适合用作Python应用程序的生产服务器。
并发测试多个 URL
在本章中,我们将学习如何同时测试多个URL。为此,我们需要编辑应用程序文件app.py以包含两个URL:
from bottle import Bottle, run

app = Bottle()

@app.route('/')
@app.route('/hello1')
def hello():
   return "Hello World! It is first URL."

@app.route('/hello2')
def hello():
   return "Hello World! It is second URL."

run(app,server = 'gunicorn',host = '127.0.0.1', port = 8080)
创建简单的Shell脚本
您可以通过创建具有多个ab调用的Shell脚本来实现此目的。创建文件test.sh并在其中添加以下行:
ab -n 100 -c 10 http://127.0.0.1:8080/hello1
ab -n 100 -c 10 http://127.0.0.1:8080/hello2
添加上述行后,保存并关闭文件。使文件可执行:
chmod u+x test.sh
现在让我们运行脚本:
./test.sh
为了避免重复和清晰起见,我们将仅显示ab输出的相关部分,并用点表示省略了哪一部分,如下所示。
输出
.
.
.
Document Path:          /hello1
Document Length:        732 bytes

Concurrency Level:      10
Time taken for tests:   0.040 seconds
Complete requests:      100
Failed requests:        0
Non-2xx responses:      100
Total transferred:      90000 bytes
HTML transferred:       73200 bytes
Requests per second:    2496.13 [#/sec] (mean)
Time per request:       4.006 [ms] (mean)
Time per request:       0.401 [ms] (mean, across all concurrent requests)
Transfer rate:          2193.87 [Kbytes/sec] received

Connection Times (ms)
              min  mean[+/-sd] median   max
Connect:        0    0   0.8      0       3
Processing:     1    3   1.0      4       5
Waiting:        0    3   1.2      4       4
Total:          1    4   0.6      4       5
WARNING: The median and mean for the processing time are not within a normal deviation
        These results are probably not that reliable.
.
.
.
将Apache Bench输出保存到文件的Shell脚本
您可以通过创建具有多个ab调用的Shell脚本将Apache Bench输出保存到文件。在每一行的末尾放置一个&; 这使得命令在后台运行,并允许下一个命令开始执行。您还希望使用<filename>将每个URL的输出重定向到文件。例如,修改后的文件test.sh将如下所示:
$ ab -n 100 -c 10 http://127.0.0.1:8080/hello1 > test1.txt &
$ ab -n 100 -c 10 http://127.0.0.1:8080/hello2 > test2.txt &
这里,test1.txt和test2.txt是保存输出数据的文件。
您可以检查上述脚本是否创建了两个文件test1.txt和test2.txt,其中包含各个URL的ab输出:
$ ls -l
输出
...
-rw-r--r-- 1 root root  5225 May 30 12:11 out.data
-rwxr--r-- 1 root root   118 Jun 10 12:24 test.sh
-rw-r--r-- 1 root root  1291 Jun 10 12:31 test1.txt
-rwxr--r-- 1 root root    91 Jun 10 13:22 test2.sh
-rw-r--r-- 1 root root  1291 Jun 10 12:31 test2.txt
...
注意情况
在使用ab时,您应该注意没有警告的测试失败。例如,如果您检查错误的URL,您可能会得到类似以下内容(我们在这里故意更改了端口)。
$ ab -l -r -n 100 -c 10 -k -H "Accept-Encoding: gzip, deflate" http://127.0.0.1:805/
输出
This is ApacheBench, Version 2.3 <$Revision: 1604373 $>
Copyright 1996 Adam Twiss, Zeus Technology Ltd, http://www.zeustech.net/
Licensed to The Apache Software Foundation, https://apache.org/

Benchmarking 127.0.0.1 (be patient).....done

Server Software:
Server Hostname:        127.0.0.1
Server Port:            805

Document Path:          /
Document Length:        Variable

Concurrency Level:      10
Time taken for tests:   0.002 seconds
Complete requests:      100
Failed requests:        150
   (Connect: 0, Receive: 100, Length: 0, Exceptions: 50)
Keep-Alive requests:    0
Total transferred:      0 bytes
HTML transferred:       0 bytes
Requests per second:    44984.26 [#/sec] (mean)
Time per request:       0.222 [ms] (mean)
Time per request:       0.022 [ms] (mean, across all concurrent requests)
Transfer rate:          0.00 [Kbytes/sec] received

Connection Times (ms)
              min  mean[+/-sd] median   max
Connect:        0    0   0.0      0       0
Processing:     0    0   0.2      0       0
Waiting:        0    0   0.0      0       0
Total:          0    0   0.2      0       0

Percentage of the requests served within a certain time (ms)
  50%      0
  66%      0
  75%      0
  80%      0
  90%      0
  95%      0
  98%      0
  99%      0
 100%      0 (longest request)
动态页面测试准备
在本章中,我们将了解测试动态页面所需的准备工作。服务器端动态网页是指其构建受处理服务器端脚本的应用程序服务器控制的网页。apache bench只能负载测试服务器端动态网页。
并发级别和请求总数
并发级别应低于请求总数。
$ ab -l -r -n 30 -c 80 -k -H "Accept-Encoding: gzip, deflate" http://127.0.0.1:8000/
输出
ab: Cannot use concurrency level greater than total number of requests
Usage: ab [options] [http[s]://]hostname[:port]/path
标志的使用
在本节中,我们将描述ab命令中一些重要标志的使用。我们将交替使用术语选项和标志。
详细 -v
详细选项可用于分析和调试是否存在多个失败请求。负载测试失败的一个常见迹象是测试非常快地完成,并且为每秒请求值提供了一个良好的数字。但这将是一个错误的基准。为了识别成功或失败,您可以使用-v 2选项,它将每个响应的主体和标题转储到终端输出。以下命令描述了一个用例:
$ ab -n 1 -v 2 http://www.generic-example-URL.com/
输出
LOG: header received:
HTTP/1.0 200 OK
…
Content-Length: 2548687
当然,如果您正在测试可变响应或在发生任何错误时返回非200 HTTP代码,则应使用-l选项简单地忽略长度检查。当我们在后续章节中启动web2py应用程序时,我们将很快看到非200 HTTP。
保持活动 -k
当客户端发送HTTP请求时,将与服务器建立连接,服务器发送响应,并在发送请求后关闭连接。此循环在每次请求时继续。但是,使用保持活动设置(也称为持久连接),客户端会保持底层TCP连接打开以促进多个请求和响应;这消除了否则存在的缓慢且代价高昂的连接初始化时间。
可变文档长度 -l
如果网页长度可变,则应使用选项-l。如果响应的长度不恒定,则Apache Bench不会报告错误。这对于动态页面很有用。
选项 -r的使用
如何强制ab在收到错误时不退出?您应该使用选项-r。如果没有此选项,您的测试可能会在任何请求遇到套接字错误时中断。但是,使用此选项,错误将在失败错误标题中报告,但测试将持续到结束。
选项 -H的使用
此选项用于添加任意标题行。参数通常采用有效的标题行形式,包含一个用冒号分隔的字段-值对(即,“Accept-Encoding: zip/zop;8bit”)。
选项 -C的使用
在下一节中,我们将详细了解如何在结合使用选项以使用cookie值(即-C选项)的情况下使用上述选项。-C选项通常采用name = value对的形式。此字段可以重复。
将会话Cookie与Apache Bench一起使用
要了解如何在Apache Bench中使用cookie,我们需要一个尝试设置cookie的网页。一个很好的例子是web2py应用程序,它是一个Python Web框架。
安装web2py
我们将快速安装另一个Python应用程序web2py。您可以在Web2py框架概述上阅读有关如何使用它的更多信息。
Python通常在Ubuntu和Debian服务器上默认安装。因此,已经满足了一个成功运行web2py的要求。
但是,我们需要安装unzip包以从我们将要下载的zip文件中提取web2py的源文件:
$ sudo apt-get update
$ sudo apt-get install unzip
让我们从项目的网站获取web2py框架。我们将将其下载到我们的主文件夹:
$cd ~
$ wget http://www.web2py.com/examples/static/web2py_src.zip
现在,我们可以解压缩刚刚下载的文件并进入其中:
$ unzip web2py_src.zip
$ cd web2py
要运行web2py,您无需安装它。进入web2py目录后,您可以通过键入以下命令来运行它:
$python web2py.py
如果一切顺利,您将看到以下输出,其中系统会要求您为管理UI选择密码:
web2py Web Framework
Created by Massimo Di Pierro, Copyright 2007-2017
Version 2.14.6-stable+timestamp.2016.05.10.00.21.47
Database drivers available: sqlite3, imaplib, pymysql, pg8000
WARNING:web2py:GUI not available because Tk library is not installed
choose a password:

please visit:
        http://127.0.0.1:8000/
use "kill -SIGTERM 23904" to shutdown the web2py server
但是,您需要注意的是,启动的Web界面只能在本地机器上访问。
从输出中,您可以了解到,要停止 Web 服务器,您需要在即时终端中输入“CTRL-C”。另一方面,要停止与同一 VPS 相关的另一个终端上的 web2py 服务器,您可以插入命令 kill -SIGTERM <PID>,其中 <PID> 是 web2py 服务器的进程 ID,在本例中为 23904。
来自 web2py 的会话 Cookie
如果一个页面只能由已登录的用户访问,而不能直接从登录页面访问,那么在这种情况下,您可以使用-C标志。此标志为 ab 命令定义了一个 cookie。但是您必须从有效的会话中获取会话标识符 cookie 的值。如何获取?各种在线教程将引导您使用 Chrome(或 Mozilla)浏览器开发者工具。但在我们的测试用例中,由于应用程序仅在命令行上可用,因此我们将使用 lynx 浏览器获取该值。
让我们首先获取会话的 cookie 值。打开另一个终端并输入以下命令:
$ lynx http://127.0.0.1:8000/
响应上述命令,lynx 将询问您是否允许接受来自 web2py 服务器的 cookie,如下面的图像所示。
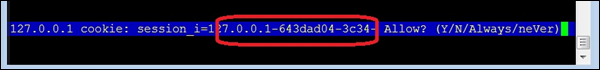
在输入y接受 cookie 之前记下 cookie 值。现在终端将类似于以下图像 - 终端上的网站!
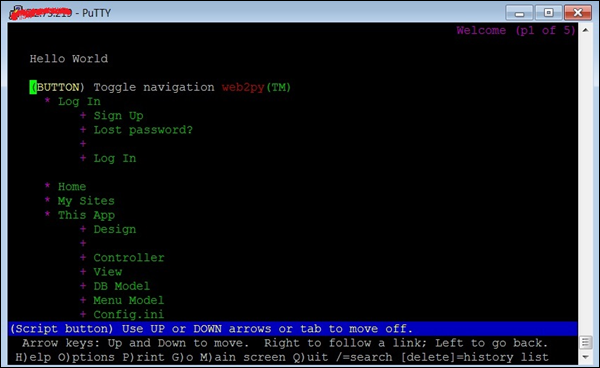
获得 cookie 值后,我们现在将运行 ab 测试。为此,我们将不得不打开第三个终端(见下图):
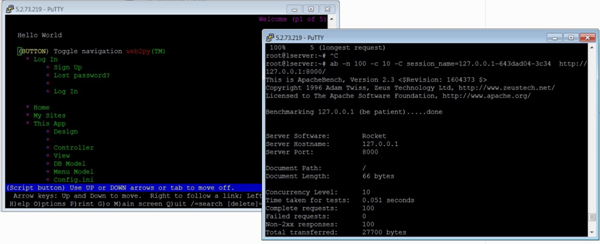
现在,让我们在第三个终端中使用 -C 标志:
$ ab -n 100 -c 10 -C session_name = 127.0.0.1-643dad04-3c34 http://127.0.0.1:8000/
输出
This is ApacheBench, Version 2.3 <$Revision: 1604373 $>
Copyright 1996 Adam Twiss, Zeus Technology Ltd, http://www.zeustech.net/
Licensed to The Apache Software Foundation, https://apache.org/

Benchmarking 127.0.0.1 (be patient).....done


Server Software:        Rocket
Server Hostname:        127.0.0.1
Server Port:            8000

Document Path:          /
Document Length:        66 bytes

Concurrency Level:      10
Time taken for tests:   0.051 seconds
Complete requests:      100
Failed requests:        0
Non-2xx responses:      100
Total transferred:      27700 bytes
HTML transferred:       6600 bytes
Requests per second:    1968.12 [#/sec] (mean)
Time per request:       5.081 [ms] (mean)
Time per request:       0.508 [ms] (mean, across all concurrent requests)
Transfer rate:          532.39 [Kbytes/sec] received

Connection Times (ms)
              min  mean[+/-sd] median   max
Connect:        1    2   0.9      2       4
Processing:     0    3   0.9      3       5
Waiting:        0    2   1.1      2       4
Total:          4    5   0.7      5       7

Percentage of the requests served within a certain time (ms)
  50%      5
  66%      5
  75%      5
  80%      6
  90%      6
  95%      6
  98%      7
  99%      7
 100%      7 (longest request)
从上面的输出中,我们注意到几点。首先,web2py 使用 Rocket Web 服务器。我们还注意到,除了之前在输出中讨论的标题外,我们还得到了“非 2xx 响应”。一般来说,Http 协议使用响应代码来响应请求,200 区间内的任何内容都表示“确定”,其余内容则对应于某些问题。例如,400 区间是与资源相关的错误,例如 404 文件未找到。500 区间对应于服务器错误。在我们的这个例子中,除了使用 -C 选项时之外,没有任何错误。它可以使用 -l 选项来抑制,如前所述。
检查管理页面
在本节中,我们将了解如何检查管理页面。为了比较的目的,让我们测试 web2py 应用程序的另一个 URL:
$ ab -n 100 -c 10 session_name = 127.0.0.1-643dad04-3c34 http://127.0.0.1:8000/admin
输出
This is ApacheBench, Version 2.3 <$Revision: 1604373 $>
Copyright 1996 Adam Twiss, Zeus Technology Ltd, http://www.zeustech.net/
Licensed to The Apache Software Foundation, https://apache.org/

Benchmarking 127.0.0.1 (be patient).....done


Server Software:        Rocket
Server Hostname:        127.0.0.1
Server Port:            8000

Document Path:          /admin
Document Length:        8840 bytes

Concurrency Level:      10
Time taken for tests:   2.077 seconds
Complete requests:      100
Failed requests:        0
Total transferred:      926700 bytes
HTML transferred:       884000 bytes
Requests per second:    48.14 [#/sec] (mean)
Time per request:       207.749 [ms] (mean)
Time per request:       20.775 [ms] (mean, across all concurrent requests)
Transfer rate:          435.61 [Kbytes/sec] received

Connection Times (ms)
          min  mean[+/-sd] median   max
Connect:        0    1   3.2      0      12
Processing:    62  204  52.2    199     400
Waiting:       61  203  52.0    199     400
Total:         62  205  54.3    199     411

Percentage of the requests served within a certain time (ms)
  50%    199
  66%    211
  75%    220
  80%    226
  90%    264
  95%    349
  98%    381
  99%    411
 100%    411 (longest request)
您应该特别注意http://127.0.0.1:8000/和http://127.0.0.1:8000/admin的“连接时间”和“请求服务百分比”部分中的相关统计数据。差别很大。
使用 Timelimit 选项
通常,Timelimit 选项是一个棘手的选项。让我们从ab 手册中了解这一点,它非常具有解释性:
-t timelimit
Maximum number of seconds to spend for benchmarking. This implies a -n 50000 internally.
Use this to benchmark the server within a fixed total amount of time.
Per default there is no timelimit.
让我们使用此选项运行一个测试。在查看输出后,我们将记下我们的观察结果:
$ ab -n 100 -c 10 -t 60 http://127.0.0.1:8000/
输出
This is ApacheBench, Version 2.3 <$Revision: 1604373 $>
Copyright 1996 Adam Twiss, Zeus Technology Ltd, http://www.zeustech.net/
Licensed to The Apache Software Foundation, https://apache.org/

Benchmarking 127.0.0.1 (be patient)
Completed 5000 requests
Completed 10000 requests
Completed 15000 requests
Completed 20000 requests
Completed 25000 requests
Completed 30000 requests
Completed 35000 requests
Completed 40000 requests
Completed 45000 requests
Completed 50000 requests
Finished 50000 requests


Server Software:        Rocket
Server Hostname:        127.0.0.1
Server Port:            8000

Document Path:          /
Document Length:        66 bytes

Concurrency Level:      10
Time taken for tests:   22.547 seconds
Complete requests:      50000
Failed requests:        0
Non-2xx responses:      50000
Total transferred:      13850000 bytes
HTML transferred:       3300000 bytes
Requests per second:    2217.61 [#/sec] (mean)
Time per request:       4.509 [ms] (mean)
Time per request:       0.451 [ms] (mean, across all concurrent requests)
Transfer rate:          599.88 [Kbytes/sec] received

Connection Times (ms)
              min  mean[+/-sd] median   max
Connect:        0    2   0.8      2       8
Processing:     0    2   3.2      2     218
Waiting:        0    2   3.2      2     218
Total:          2    4   3.1      4     220

Percentage of the requests served within a certain time (ms)
  50%      4
  66%      4
  75%      4
  80%      5
  90%      5
  95%      5
  98%      7
  99%      8
 100%    220 (longest request)
请注意,输出显示此选项会覆盖-n选项指定的请求数量,并持续执行多达 50K 个请求。但是,由于请求处理得非常快,ab 一旦达到 50k 标记就会立即终止 - 在本例中,在 22 秒内(请参阅标题“测试花费的时间”)。
您可以测试相同的命令,将http://127.0.0.1:8000/替换为http://127.0.0.1:8000/admin(假设它是我们的 web2py 应用程序)或第三方网站,例如 https://apache.org/,注意统计数据的差异。
执行负载测试前的检查清单
有一些检查将帮助您成功运行测试并准确地衡量性能。在执行负载测试之前,请考虑以下条件:
确保没有加载额外的 Python 模块。
为了避免 TCP/IP 端口耗尽,您通常应该在转到另一个 ab 测试之前等待 2-3 分钟。
确保并发连接数低于 Apache 工作线程数。
如果 Apache 或 Python 崩溃,您应该在执行另一个测试之前重新启动服务器。
动态页面的顺序测试用例
在本章中,我们将描述-n和-c与重要标志的各种组合,以逐渐增加 Web 服务器上的负载。
您应该主要关注以下指标在您增加负载时的变化情况:
- 每秒请求数
- 连接时间(毫秒)
- 在特定时间(毫秒)内完成的请求百分比
您还应该注意服务器开始卡住并开始出现失败请求时的阈值。
1 个并发用户执行 100 次页面点击
让我们由单个用户执行 100 次顺序页面加载:
$ ab -l -r -n 100 -c 1 -k -H "Accept-Encoding: gzip, deflate" http://127.0.0.1:8000/
输出
This is ApacheBench, Version 2.3 <$Revision: 1604373 $>
Copyright 1996 Adam Twiss, Zeus Technology Ltd, http://www.zeustech.net/
Licensed to The Apache Software Foundation, https://apache.org/

Benchmarking 127.0.0.1 (be patient).....done


Server Software:        Rocket
Server Hostname:        127.0.0.1
Server Port:            8000

Document Path:          /
Document Length:        Variable

Concurrency Level:      1
Time taken for tests:   0.045 seconds
Complete requests:      100
Failed requests:        0
Non-2xx responses:      100
Keep-Alive requests:    0
Total transferred:      27700 bytes
HTML transferred:       6600 bytes
Requests per second:    2206.24 [#/sec] (mean)
Time per request:       0.453 [ms] (mean)
Time per request:       0.453 [ms] (mean, across all concurrent requests)
Transfer rate:          596.80 [Kbytes/sec] received

Connection Times (ms)
              min  mean[+/-sd] median   max
Connect:        0    0   0.0      0       0
Processing:     0    0   0.0      0       0
Waiting:        0    0   0.0      0       0
Total:          0    0   0.0      0       1

Percentage of the requests served within a certain time (ms)
  50%      0
  66%      0
  75%      0
  80%      0
  90%      1
  95%      1
  98%      1
  99%      1
 100%      1 (longest request)
5 个并发用户,每个用户执行 10 次页面点击
此案例对应于每月获得约 50,000+ 次点击的网站的峰值负载。
$ ab -l -r -n 10 -c 5 -k -H "Accept-Encoding: gzip, deflate" http://127.0.0.1:8000/
在以下后续输出中,为了清晰起见,我们将省略通用标题。
输出
...
Requests per second:    2009.24 [#/sec] (mean)
Time per request:       2.488 [ms] (mean)
Time per request:       0.498 [ms] (mean, across all concurrent requests)
Transfer rate:          543.52 [Kbytes/sec] received

Connection Times (ms)
              min  mean[+/-sd] median   max
Connect:        0    1   0.5      1       2
Processing:     0    1   0.5      1       2
Waiting:        0    1   0.5      1       1
Total:          2    2   0.4      3       3
ERROR: The median and mean for the total time are more than twice the standard
       deviation apart. These results are NOT reliable.

Percentage of the requests served within a certain time (ms)
  50%      3
  66%      3
  75%      3
  80%      3
  90%      3
  95%      3
  98%      3
  99%      3
 100%      3 (longest request)
10 个并发用户,每个用户执行 10 次页面点击
此测试对应于 10 个不同的并发用户执行 100 次页面加载,每个用户执行 10 次顺序页面加载。
$ ab -r -n 10 -c 10 -k -H "Accept-Encoding: gzip, deflate" http://127.0.0.1:8000/
输出
...
Requests per second:    2225.68 [#/sec] (mean)
Time per request:       4.493 [ms] (mean)
Time per request:       0.449 [ms] (mean, across all concurrent requests)
Transfer rate:          602.07 [Kbytes/sec] received

Connection Times (ms)
              min  mean[+/-sd] median   max
Connect:        1    2   0.7      2       3
Processing:     0    2   1.0      2       3
Waiting:        0    1   1.0      2       3
Total:          4    4   0.3      4       4
WARNING: The median and mean for the waiting time are not within a normal deviation
        These results are probably not that reliable.

Percentage of the requests served within a certain time (ms)
  50%      4
  66%      4
  75%      4
  80%      4
  90%      4
  95%      4
  98%      4
  99%      4
 100%      4 (longest request)
20 个并发用户,每个用户执行 20 次页面点击
此测试对应于 20 个不同的并发用户执行 400 次页面加载,每个用户执行 20 次顺序页面加载。
$ ab -r -n 20 -c 20 -k -H “Accept-Encoding: gzip, deflate” http://127.0.0.1:8000/
输出
...
Requests per second:    1619.96 [#/sec] (mean)
Time per request:       12.346 [ms] (mean)
Time per request:       0.617 [ms] (mean, across all concurrent requests)
Transfer rate:          438.21 [Kbytes/sec] received

Connection Times (ms)
              min  mean[+/-sd] median   max
Connect:        2    6   2.3      6      10
Processing:     1    5   2.9      5      10
Waiting:        0    5   2.9      5       9
Total:         10   11   0.6     11      12

Percentage of the requests served within a certain time (ms)
  50%     11
  66%     11
  75%     12
  80%     12
  90%     12
  95%     12
  98%     12
  99%     12
 100%     12 (longest request)
30 个并发用户,每个用户执行 30 次页面点击
此测试对应于 30 个不同的并发用户执行 900 次页面加载,每个用户执行 30 次顺序页面加载。
$ ab -r -n 30 -c 30 -k -H "Accept-Encoding: gzip, deflate" http://127.0.0.1:8000/
输出
...
Requests per second:    2283.45 [#/sec] (mean)
Time per request:       13.138 [ms] (mean)
Time per request:       0.438 [ms] (mean, across all concurrent requests)
Transfer rate:          617.69 [Kbytes/sec] received

Connection Times (ms)
              min  mean[+/-sd] median   max
Connect:        2    6   2.7      6      11
Processing:     1    6   3.1      6      11
Waiting:        0    5   3.2      5      10
Total:         11   12   0.5     12      13

Percentage of the requests served within a certain time (ms)
  50%     12
  66%     12
  75%     12
  80%     12
  90%     13
  95%     13
  98%     13
  99%     13
 100%     13 (longest request)
我们现在已经了解了如何逐渐增加网站的负载并测试其性能。
Apache Bench - 输出比较
在本章中,我们将比较带有和不带标志的输出。让我们看看如何使用适当的标志可以提高 Web 应用程序的性能。在此之前,我们需要了解如果您的应用程序很简单,那么您可能不会注意到差异。就像我们的简单应用程序一样,使用标志和不使用标志。然后,我们将使用 https://apache.org/ URL 执行相同的测试,并查看差异。
测试我们的应用程序(不带标志)
在本节中,我们将了解如何测试我们的应用程序(不带标志)。
$ ab -n 100 -c 10 http://127.0.0.1:8000/
输出
This is ApacheBench, Version 2.3 <$Revision: 1604373 $>
Copyright 1996 Adam Twiss, Zeus Technology Ltd, http://www.zeustech.net/
Licensed to The Apache Software Foundation, https://apache.org/

Benchmarking 127.0.0.1 (be patient).....done


Server Software:        Rocket
Server Hostname:        127.0.0.1
Server Port:            8000

Document Path:          /
Document Length:        Variable

Concurrency Level:      10
Time taken for tests:   0.244 seconds
Complete requests:      100
Failed requests:        0
Non-2xx responses:      100
Keep-Alive requests:    0
Total transferred:      27700 bytes
HTML transferred:       6600 bytes
Requests per second:    2208.77 [#/sec] (mean)
Time per request:       4.527 [ms] (mean)
Time per request:       0.453 [ms] (mean, across all concurrent requests)
Transfer rate:          597.49 [Kbytes/sec] received

Connection Times (ms)
              min  mean[+/-sd] median   max
Connect:        1    2   0.7      2       3
Processing:     0    2   0.7      2       4
Waiting:        0    2   1.0      2       3
Total:          4    4   0.3      4       5

Percentage of the requests served within a certain time (ms)
  50%      4
  66%      4
  75%      5
  80%      5
  90%      5
  95%      5
  98%      5
  99%      5
 100%      5 (longest request)
测试我们的应用程序(带标志)
在本节中,我们将了解如何测试我们的应用程序(带标志)。
$ ab -l -r -n 100 -c 10 -k -H "Accept-Encoding: gzip, deflate" http://127.0.0.1:8000/
输出
...
Requests per second:    2277.07 [#/sec] (mean)
Time per request:       4.392 [ms] (mean)
Time per request:       0.439 [ms] (mean, across all concurrent requests)
Transfer rate:          615.97 [Kbytes/sec] received

Connection Times (ms)
              min  mean[+/-sd] median   max
Connect:        1    2   0.7      2       3
Processing:     0    2   0.7      2       4
Waiting:        0    2   1.0      2       3
Total:          4    4   0.2      4       5

Percentage of the requests served within a certain time (ms)
  50%      4
  66%      4
  75%      4
  80%      4
  90%      5
  95%      5
  98%      5
  99%      5
 100%      5 (longest request)
我们可以简单地注意到输出统计数据之间没有太大差异。
测试 Apache 组织网站(不带标志)
现在让我们看看如何测试 Apache 组织网站(不带标志)。
$ ab -n 100 -c 10 https://apache.org/
输出
This is ApacheBench, Version 2.3 <$Revision: 1604373 $>
Copyright 1996 Adam Twiss, Zeus Technology Ltd, http://www.zeustech.net/
Licensed to The Apache Software Foundation, https://apache.org/

Benchmarking www.apache.org (be patient).....done

Server Software:        Apache/2.4.7
Server Hostname:        www.apache.org
Server Port:            80

Document Path:          /
Document Length:        58433 bytes

Concurrency Level:      10
Time taken for tests:   1.498 seconds
Complete requests:      100
Failed requests:        0
Total transferred:      5877500 bytes
HTML transferred:       5843300 bytes
Requests per second:    66.74 [#/sec] (mean)
Time per request:       149.840 [ms] (mean)
Time per request:       14.984 [ms] (mean, across all concurrent requests)
Transfer rate:          3830.58 [Kbytes/sec] received

Connection Times (ms)
              min  mean[+/-sd] median   max
Connect:       12  110 295.2     12    1012
Processing:    37   38   0.5     38      39
Waiting:       12   13   0.3     13      15
Total:         49  147 295.4     50    1051

Percentage of the requests served within a certain time (ms)
  50%     50
  66%     50
  75%     50
  80%     50
  90%    816
  95%   1050
  98%   1051
  99%   1051
 100%   1051 (longest request)
测试 Apache 组织网站(带标志)
现在让我们使用标志测试 Apache 组织网站。
$ ab -l -r -n 100 -c 10 -k -H "Accept-Encoding: gzip, deflate" https://apache.org/
输出
...
Document Length:        Variable

Concurrency Level:      10
Time taken for tests:   0.357 seconds
Complete requests:      100
Failed requests:        0
Keep-Alive requests:    100
Total transferred:      1358510 bytes
HTML transferred:       1317700 bytes
Requests per second:    280.28 [#/sec] (mean)
Time per request:       35.678 [ms] (mean)
Time per request:       3.568 [ms] (mean, across all concurrent requests)
Transfer rate:          3718.41 [Kbytes/sec] received

Connection Times (ms)
              min  mean[+/-sd] median   max
Connect:        0    1   3.7      0      12
Processing:    14   17  21.3     15     227
Waiting:       14   17  21.3     14     227
Total:         14   18  21.5     15     227

Percentage of the requests served within a certain time (ms)
  50%     15
  66%     15
  75%     15
  80%     15
  90%     27
  95%     28
  98%     29
  99%    227
 100%    227 (longest request)
您可以简单地注意到,使用标志后每秒请求数增加了。在本例中,这尤其归因于使用-H "Accept-Encoding: gzip, deflate,因为此标志告诉 Apache 服务器以gzipped格式提供请求。
考虑 Apache Bench 结果
在涉及 Apache Bench 结果时,需要考虑一些重要事项。这将帮助我们设计整体策略,以消除应用程序中的瓶颈并提高其性能。
我们需要每秒请求数。这让我们了解 Web 服务器设置运行状况如何;数字越大,性能越好。然后是连接时间(毫秒)和请求服务百分比。您可能需要调整 Web 服务器的设置,以将这些指标更改为您所需的性能。
检查 Apache 或使用的 Web 服务器错误日志或(通用)日志中是否存在错误。随着负载的增加,事情将开始变得拥堵:内存问题将开始出现。如果未考虑到并发性,许多 Python 脚本将开始崩溃。
您需要找出 Web 服务器崩溃和/或超时时的关键并发值是多少?通常,这应该发生在相当高的并发级别。如果此值较低,则说明某些地方出现了问题,您需要调整这些设置(降低/提高)。
结论
在本教程中,我们学习了如何使用 Apache Bench 来负载测试任何网站或 Web 应用程序。Apache Bench 可以成为确定如何改进 Web 应用程序服务器设置(以减少瓶颈并提高性能)的非常有价值的工具。现在您已经熟悉了 Apache Bench 的基本用法,您可以开始创建新的测试计划,以在各种场景中衡量应用程序的性能。