
 数据结构
数据结构 网络
网络 关系数据库管理系统
 操作系统
操作系统 Java
Java iOS
iOS HTML
HTML CSS
CSS Android
 Python
 C 编程
C 编程 C++
C++ C#
C# MongoDB
 MySQL
MySQL Javascript
 PHP
PHP如何使用 Python 中的 Matplotlib 创建三维等高线图?
Matplotlib 是一个流行的 Python 包,用于数据可视化。可视化数据是一个关键步骤,因为它有助于理解数据中正在发生的事情,而无需实际查看数字并执行复杂的计算。它有助于有效地将定量见解传达给受众。
Matplotlib 用于使用数据创建二维图。它带有一个面向对象的 API,有助于将绘图嵌入 Python 应用程序中。Matplotlib 可以与 IPython shell、Jupyter notebook、Spyder IDE 等一起使用。
它用 Python 编写。它是使用 NumPy 创建的,NumPy 是 Python 中的数值 Python 包。
可以使用以下命令在 Windows 上安装 Python:
pip install matplotlib
Matplotlib 的依赖项为:
Python ( greater than or equal to version 3.4)
NumPy
Setuptools
Pyparsing
Libpng
Pytz
Free type
Six
Cycler
Dateutil
创建三维图是为了查看数据点的 x-、y- 和 z- 轴。它也可用于了解梯度下降函数的工作原理,以及为算法找到系数的最佳值。
让我们了解如何使用 Matplotlib 创建三维等高线图:
示例
from mpl_toolkits import mplot3d
import numpy as np
import matplotlib.pyplot as plt
def fun(x, y):
return np.sin(np.sqrt(x ** 2 + y ** 2))
x = np.linspace(−5, 5, 30)
y = np.linspace(−5, 5, 30)
X, Y = np.meshgrid(x, y)
Z = fun (X, Y)
fig = plt.figure()
ax = plt.axes(projection='3d')
ax.contour3D(X, Y, Z, 50, cmap='binary')
ax.set_ylabel("Y−axis")
ax.set_xlabel("X−axis")
ax.set_zlabel("Z−axis")
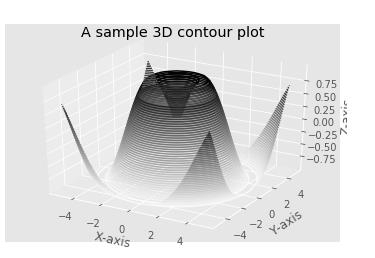
ax.set_title('A sample 3D contour plot')
plt.show()输出
解释
导入所需的包并定义其别名以方便使用。
创建一个名为“fun”的函数,该函数使用两个变量使用“sin”函数生成数据。
使用 NumPy 库创建数据值。
使用“figure”函数创建一个空图形。
使用“axes”函数创建绘制图形的轴。
“contour3D”用于指定正在使用已创建的数据可视化 3 维等高线图。
使用 set_xlabel、set_ylabel、'z_label' 和 set_title 函数为 X 轴、Y 轴、Z 轴和标题提供标签。
使用“show”函数在控制台上显示。

更新于:2021 年 1 月 18 日
220 次查看

广告