
 数据结构
数据结构 网络
网络 关系型数据库管理系统
 操作系统
操作系统 Java
Java iOS
iOS HTML
HTML CSS
CSS Android
 Python
 C 编程
C 编程 C++
C++ C#
C# MongoDB
 MySQL
MySQL Javascript
 PHP
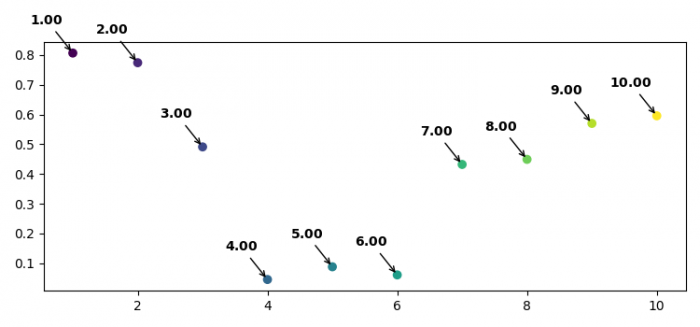
PHP如何在 Matplotlib 中使用一段文字对多个点进行注释?
若要在 Matplotlib 中为多个点添加带注释的文本,我们可以采取以下步骤 -
- 设置图形大小并调整子图之间的内边距。
- 使用 numpy 创建 x 和 y 数据点。
- 创建一个标签列表,用于设置每个散点图的标签。
- 使用**scatter()**方法绘制 xpoints、ypoints。对于颜色,使用 xpoints。
- 迭代拉链标签、xpoints 和 ypoints。
- 在循环中使用带有加粗 LaTeX 表示形式的 annotate() 方法。
- 使用**show()**方法显示图形。
示例
import numpy as np
from matplotlib import pyplot as plt

plt.rcParams["figure.figsize"] = [7.50, 3.50]
plt.rcParams["figure.autolayout"] = True

xpoints = np.linspace(1, 10, 10)
ypoints = np.random.rand(10)

labels = ["%.2f" % i for i in xpoints]

plt.scatter(xpoints, ypoints, c=xpoints)

for label, x, y in zip(labels, xpoints, ypoints):
   plt.annotate(
      f"$\bf{label}$",
      xy=(x, y), xytext=(-20, 20),
      textcoords='offset points', ha='center', va='bottom',
      arrowprops=dict(arrowstyle='->', connectionstyle='arc3,rad=0'))

plt.show()
输出


更新时间:04-08-2021
1K+ 次浏览

广告