
 数据结构
数据结构 网络
网络 RDBMS
RDBMS 操作系统
操作系统 Java
Java iOS
iOS HTML
HTML CSS
CSS Android
 Python
 C 编程
C 编程 C++
C++ C#
C# MongoDB
 MySQL
MySQL Javascript
 PHP
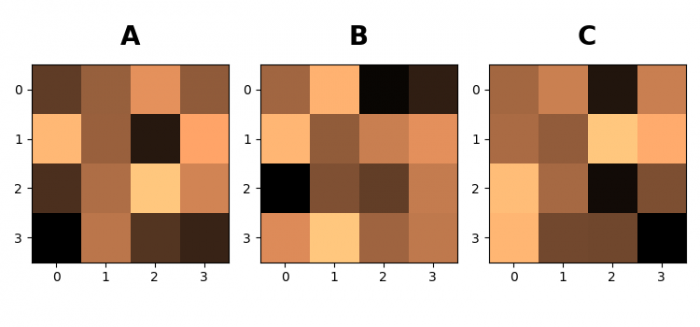
PHP使用 Matplotlib 在图形中的子图上标注 A、B、C
要使用 matplotlib 在图形中的子图上标注 A、B 和 C,我们可以采用以下步骤
- 设置图形尺寸并调整子图之间的和子图周围的边距。
- 使用 nrows=1 和 ncols=3 创建一个图形和一组子图。
- 对一个数组进行 1D 迭代。
- 为每个轴迭代并以图像的形式显示数据。
- 在循环中放置文本 A、B 和 C。
- 使用 show() 方法显示图形。
示例
import numpy as np
from matplotlib import pyplot as plt
import string
plt.rcParams["figure.figsize"] = [7.50, 3.50]
plt.rcParams["figure.autolayout"] = True
fig, axs = plt.subplots(1, 3)
axs = axs.flat
for index, ax in enumerate(axs):
ax.imshow(np.random.randn(4, 4), interpolation='nearest',
cmap="copper")
ax.text(0.45, 1.1, string.ascii_uppercase[index],
transform=ax.transAxes,
size=20, weight='bold')
plt.show()
输出

更新于: 01-06-2021
2 千 + 次浏览

广告