
 数据结构
数据结构 网络
网络 关系数据库管理系统 (RDBMS)
 操作系统
操作系统 Java
Java iOS
iOS HTML
HTML CSS
CSS Android
 Python
 C 编程
C 编程 C++
C++ C#
C# MongoDB
 MySQL
MySQL Javascript
 PHP
PHP如何在 JavaFX XY 图表中更改刻度标记的颜色和字体?
javafx.scene.XYChart 类是所有在 xy 平面中绘制的图表的基础类。通过实例化此类的子类,您可以创建各种 XY 图表,例如:线图、区域图、条形图、饼图、气泡图、散点图等。
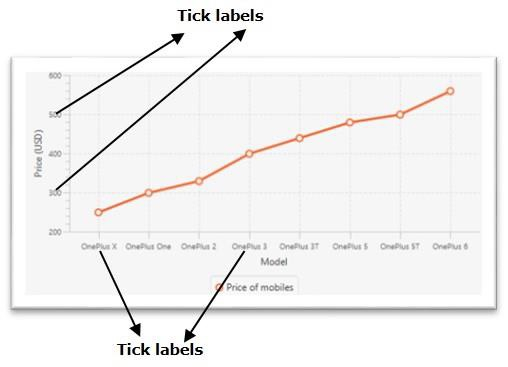
在 XY 图表中,给定的数据点绘制在 XY 平面上。在 x 轴和 y 轴上,您将有刻度标记和刻度标签。标签指定值的名字(或数字)。
更改刻度标签的颜色
javafx.scene.chart.Axis 类(抽象类)是 XY 图表中所有轴的基础类。要创建 X 轴和 Y 轴,您需要实例化这些类的子类。
NumberAxis 类用于创建数值轴,而 CategoryAxis 类用于创建字符串类别轴。
Axis 类有两个属性:
tickLabelFill - 此属性指定当前轴中所有刻度标签的填充颜色。您可以使用 setTickLabelFill() 方法设置此属性的值。
tickLabelFont - 此属性指定当前轴中所有刻度标签的字体。您可以使用 setTickLabelFont() 方法设置此属性的值。
您可以使用这些方法设置 XY 图表刻度标签所需的颜色和字体。
示例
import javafx.application.Application;
import javafx.geometry.Insets;
import javafx.scene.Scene;
import javafx.scene.chart.BubbleChart;
import javafx.stage.Stage;
import javafx.scene.chart.NumberAxis;
import javafx.scene.chart.XYChart;
import javafx.scene.layout.StackPane;
import javafx.scene.paint.Color;
public class BubbleChart_Color extends Application {
   public void start(Stage stage) {
      //Creating X and Y axes
      NumberAxis xAxis = new NumberAxis(0, 90, 10);
      NumberAxis yAxis = new NumberAxis(20, 90, 10);
      //Creating labels to the axes
      xAxis.setLabel("Age");
      yAxis.setLabel("Weight");
      //Creating the Bubble chart
      BubbleChart bubbleChart = new BubbleChart(xAxis, yAxis);
      //Preparing data for bubble chart
      XYChart.Series series = new XYChart.Series();
      series.getData().add(new XYChart.Data(10, 30, 4));
      series.getData().add(new XYChart.Data(25, 40, 5));
      series.getData().add(new XYChart.Data(40, 50, 6));
      series.getData().add(new XYChart.Data(55, 60, 8));
      series.getData().add(new XYChart.Data(70, 70, 9));
      //series.getData().add(new XYChart.Data(85, 80, 12));
      //Setting the data to bar chart
      bubbleChart.getData().add(series);
      //Setting name to the bubble chart
      series.setName("work");
      //Setting color to tick labels
      xAxis.setTickLabelFill(Color.RED);
      yAxis.setTickLabelFill(Color.RED);
      //Creating a stack pane to hold the chart
      StackPane pane = new StackPane(bubbleChart);
      pane.setPadding(new Insets(15, 15, 15, 15));
      pane.setStyle("-fx-background-color: BEIGE");
      //Setting the Scene
      Scene scene = new Scene(pane, 595, 350);
      stage.setTitle("Bubble Chart");
      stage.setScene(scene);
      stage.show();
   }
   public static void main(String args[]){
      launch(args);
   }
}
输出


更新于:2020年5月20日
636 次浏览

广告