
 数据结构
数据结构 网络
网络 关系数据库管理系统
 操作系统
操作系统 Java
Java iOS
iOS HTML
HTML CSS
CSS Android
 Python
 C 编程
C 编程 C++
C++ C#
C# MongoDB
 MySQL
MySQL Javascript
 PHP
PHP如何在 JavaFX XY 图表中移除刻度标签?
javafx.scene.XYChart 类是所有在 x-y 平面中绘制的图表的基类。通过实例化此类的子类,您可以创建各种 XY 图表,例如 - 线形图、面积图、条形图、饼图、气泡图、散点图等。
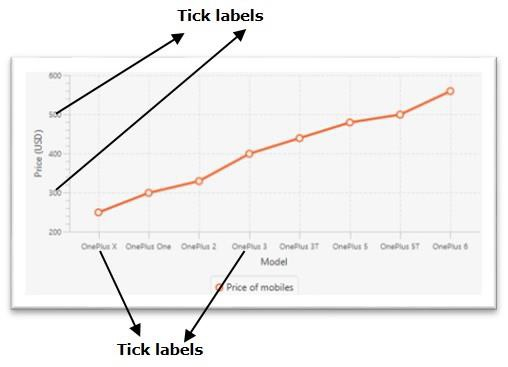
在 XY 图表中,给定的数据点绘制在 XY 平面上。在 x 和 y 轴上,您将有刻度标记和标签。标签指定值的名称(或数字)。
更改刻度标记的颜色
javafx.scene.chart.Axis 类(抽象)是 XY 图表中所有轴的基类。要创建 X 和 Y 轴,您需要实例化这些类的子类。
NumberAxis 类用于创建数值轴,而 CategoryAxis 类用于创建字符串类别的轴。
此类有一个名为 tickLabelVisible(布尔型)的属性,它指定是否显示刻度标记。您可以使用 setTickLabelVisible() 方法设置此属性的值。
要移除 XY 图表的刻度标签,请通过传递布尔值 false 调用此方法。
示例
import javafx.application.Application;
import javafx.geometry.Insets;
import javafx.scene.Scene;
import javafx.stage.Stage;
import javafx.scene.chart.CategoryAxis;
import javafx.scene.chart.LineChart;
import javafx.scene.chart.NumberAxis;
import javafx.scene.chart.XYChart;
import javafx.scene.layout.StackPane;
public class RemovingTickLabels extends Application {
   public void start(Stage stage) {
      //Defining the x an y axes
      CategoryAxis xAxis = new CategoryAxis();
      NumberAxis yAxis = new NumberAxis(200, 600, 100);
      //Setting labels for the axes
      xAxis.setLabel("Model");
      yAxis.setLabel("Price (USD)");
      //Creating a line chart
      LineChart linechart = new LineChart(xAxis, yAxis);
      //Preparing the data points for the line
      XYChart.Series series = new XYChart.Series();
      series.getData().add(new XYChart.Data("OnePlus X", 249));
      series.getData().add(new XYChart.Data("OnePlus One", 299));
      series.getData().add(new XYChart.Data("OnePlus 2", 329));
      series.getData().add(new XYChart.Data("OnePlus 3", 399));
      series.getData().add(new XYChart.Data("OnePlus 3T", 439));
      series.getData().add(new XYChart.Data("OnePlus 5", 479));
      series.getData().add(new XYChart.Data("OnePlus 5T", 499));
      series.getData().add(new XYChart.Data("OnePlus 6", 559));
      //Setting the name to the line (series)
      series.setName("Price of mobiles");
      //Setting the data to Line chart
      linechart.getData().add(series);
      //Removing the tick labels
      xAxis.setTickLabelsVisible(false);
      yAxis.setTickLabelsVisible(false);
      //Creating a stack pane to hold the chart
      StackPane pane = new StackPane(linechart);
      pane.setPadding(new Insets(15, 15, 15, 15));
      pane.setStyle("-fx-background-color: BEIGE");
      //Setting the Scene
      Scene scene = new Scene(pane, 595, 300);
      stage.setTitle("JavaFX Example");
      stage.setScene(scene);
      stage.show();
   }
   public static void main(String args[]){
      launch(args);
   }
}
输出


更新于: 2020年5月20日
555 次查看

广告