
 Data Structure
 Networking
 RDBMS
RDBMS Operating System
 Java
Java iOS
iOS HTML
HTML CSS
CSS Android
 Python
 C Programming
 C++
C++ C#
C# MongoDB
 MySQL
MySQL Javascript
 PHP
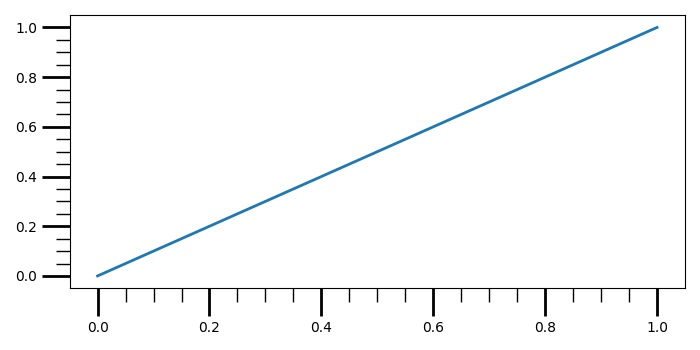
PHP如何在 Matplotlib 中制作更长的子图刻度标记?
要使 matplotlib 中的子图刻度标记更长,我们可以使用 tick_params() 方法,设置次要刻度和主要刻度的长度和宽度。
步骤
使用 subplot() 方法将子图添加到当前图形。
绘制范围(2)值
s 作为 x 和 y 数据点。
打开 colorbar 的次要刻度而不扩展到“扩展区域”。
使用 tick_params 更改刻度和刻度标签的外观。
要显示图形,请使用 show() 方法。
例子
from matplotlib import pyplot as plt
plt.rcParams["figure.figsize"] = [7.00, 3.50]
plt.rcParams["figure.autolayout"] = True
ax1 = plt.subplot()
ax1.plot(range(2), range(2), linewidth=2)
ax1.minorticks_on()
ax1.tick_params('both', length=20, width=2, which='major')
ax1.tick_params('both', length=10, width=1, which='minor')
plt.show()
输出

更新于:2021-05-15
3000+ 浏览

广告