
 数据结构
数据结构 网络
网络 关系型数据库管理系统
 操作系统
操作系统 Java
Java iOS
iOS HTML
HTML CSS
CSS Android
 Python
 C 编程
C 编程 C++
C++ C#
C# MongoDB
 MySQL
MySQL Javascript
 PHP
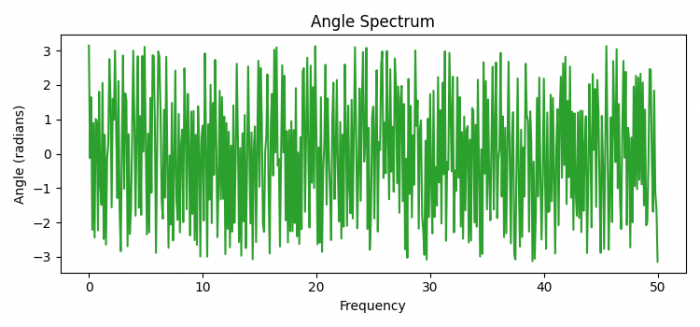
PHP如何使用 Python 中的 Matplotlib 绘制角度谱?
要绘制角度谱,我们可以采取以下步骤 −
- 设置图像大小,并调整子图之间的和周围的内边距。
- 获取随机种子值。
- 初始化采样频率的 dt 以及采样频率。
- 创建 t 的随机数据点。
- 要生成噪声,请使用 numpy 获取 nse、r、cnse 和 s。
- 使用 subplots() 方法创建图像和一组子图。
- 设置绘图的标题。
- 绘制角度谱。
- 要显示图像,请使用 show() 方法。
示例
import matplotlib.pyplot as plt
import numpy as np

plt.rcParams["figure.figsize"] = [7.50, 3.50]
plt.rcParams["figure.autolayout"] = True

np.random.seed(0)

dt = 0.01 # sampling interval
Fs = 1 / dt # sampling frequency
t = np.arange(0, 10, dt)

# generate noise:
nse = np.random.randn(len(t))
r = np.exp(-t / 0.05)
cnse = np.convolve(nse, r) * dt
cnse = cnse[:len(t)]
s = 0.1 * np.sin(4 * np.pi * t) + cnse

fig, axs = plt.subplots()
axs.set_title("Phase Spectrum ")
axs.phase_spectrum(s, Fs=Fs, color='C2')

plt.show()
输出

更新于: 2021 年 6 月 17 日
459 次浏览

广告