
 数据结构
数据结构 网络
网络 关系数据库管理系统 (RDBMS)
 操作系统
操作系统 Java
Java iOS
iOS HTML
HTML CSS
CSS Android
 Python
 C语言编程
C语言编程 C++
C++ C#
C# MongoDB
 MySQL
MySQL Javascript
 PHP
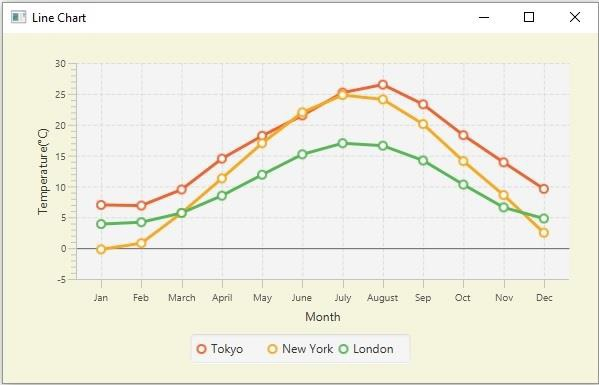
PHPJavaFX 线图示例,包含多个序列(线条)
内联图表,数据值表示由线连接的一系列点。在 JavaFX 中,您可以通过实例化 **javafx.scene.chart.LineChart** 类来创建线图。
实例化此类时,必须传递 Axis 类的两个对象,分别表示 x 轴和 y 轴(作为构造函数的参数)。由于 Axis 类是抽象类,因此您需要传递其具体子类的对象,例如 NumberAxis(用于数值)或 CategoryAxis(用于字符串值)。
包含多个序列的线图
**XYChart.Data** 类表示图表中的数据点,您可以通过实例化此类来创建数据点。
XYChart.Data dataPoint1 = new XYChart.Data(x-value, y-value)
XYChart.Data dataPoint2 = new XYChart.Data(x-value, y-value)
XYChart.Data dataPoint3 = new XYChart.Data(x-value, y-value)
创建所有所需的数据点后,您可以创建序列,需要实例化 **XYChart.Series** 类并将数据点添加到其中。
XYChart.Series series = XYChart.Series
series.getData().add(dataPoint1);
series.getData().add(dataPoint2);
series.getData().add(dataPoint3);
您可以根据需要创建任意数量的此类序列。
示例
以下示例演示如何创建包含多条线的线图。
import javafx.application.Application;
import javafx.scene.Scene;
import javafx.stage.Stage;
import javafx.scene.chart.CategoryAxis;
import javafx.scene.chart.LineChart;
import javafx.scene.chart.NumberAxis;
import javafx.scene.chart.XYChart;
import javafx.scene.layout.StackPane;
public class LineChart_MultipleLines extends Application {
   public void start(Stage stage) {
      //Defining the x an y axes
      CategoryAxis xAxis = new CategoryAxis();
      NumberAxis yAxis = new NumberAxis();
      //Setting labels for the axes
      xAxis.setLabel("Month");
      yAxis.setLabel("Temperature(°C)");
      //Creating a line chart
      LineChart<String, Number> linechart = new LineChart<String, Number>(xAxis, yAxis);
      //Preparing the data points for the line1
      XYChart.Series series1 = new XYChart.Series();
      series1.getData().add(new XYChart.Data("Jan", 7.0));
      series1.getData().add(new XYChart.Data("Feb", 6.9));
      series1.getData().add(new XYChart.Data("March", 9.5));
      series1.getData().add(new XYChart.Data("April", 14.5));
      series1.getData().add(new XYChart.Data("May", 18.2));
      series1.getData().add(new XYChart.Data("June", 21.5));
      series1.getData().add(new XYChart.Data("July", 25.2));
      series1.getData().add(new XYChart.Data("August", 26.5));
      series1.getData().add(new XYChart.Data("Sep", 23.3));
      series1.getData().add(new XYChart.Data("Oct", 18.3));
      series1.getData().add(new XYChart.Data("Nov", 13.9));
      series1.getData().add(new XYChart.Data("Dec", 9.6));
      //Preparing the data points for the line2
      XYChart.Series series2 = new XYChart.Series();
      series2.getData().add(new XYChart.Data("Jan", -0.2));
      series2.getData().add(new XYChart.Data("Feb", 0.8));
      series2.getData().add(new XYChart.Data("March", 5.7));
      series2.getData().add(new XYChart.Data("April", 11.3));
      series2.getData().add(new XYChart.Data("May", 17.0));
      series2.getData().add(new XYChart.Data("June", 22.0));
      series2.getData().add(new XYChart.Data("July", 24.8));
      series2.getData().add(new XYChart.Data("August", 24.1));
      series2.getData().add(new XYChart.Data("Sep", 20.1));
      series2.getData().add(new XYChart.Data("Oct", 14.1));
      series2.getData().add(new XYChart.Data("Nov", 8.6));
      series2.getData().add(new XYChart.Data("Dec", 2.5));
      //Preparing the data points for the line3
      XYChart.Series series3 = new XYChart.Series();
      series3.getData().add(new XYChart.Data("Jan", 3.9));
      series3.getData().add(new XYChart.Data("Feb", 4.2));
      series3.getData().add(new XYChart.Data("March", 5.7));
      series3.getData().add(new XYChart.Data("April", 8.5));
      series3.getData().add(new XYChart.Data("May", 11.9));
      series3.getData().add(new XYChart.Data("June", 15.2));
      series3.getData().add(new XYChart.Data("July", 17.0));
      series3.getData().add(new XYChart.Data("August", 16.6));
      series3.getData().add(new XYChart.Data("Sep", 14.2));
      series3.getData().add(new XYChart.Data("Oct", 10.3));
      series3.getData().add(new XYChart.Data("Nov", 6.6));
      series3.getData().add(new XYChart.Data("Dec", 4.8));
      //Setting the name to the line (series)
      series1.setName("Tokyo");
      series2.setName("New York");
      series3.setName("London");
      //Setting the data to Line chart
      linechart.getData().addAll(series1, series2, series3);
      //Creating a stack pane to hold the chart
      StackPane pane = new StackPane(linechart);
      pane.setPadding(new Insets(15, 15, 15, 15));
      pane.setStyle("-fx-background-color: BEIGE");
      //Setting the Scene
      Scene scene = new Scene(pane, 595, 350);
      stage.setTitle("Line Chart");
      stage.setScene(scene);
      stage.show();
   }
   public static void main(String args[]){
      launch(args);
   }
}
输出

更新于:2020年5月20日
1K+ 次浏览

广告