Opencv Python – 如何显示图像上点击点的坐标?
OpenCV 为我们提供了不同类型的鼠标事件。有不同类型的鼠标事件,例如左键或右键单击、鼠标移动、左键双击等。鼠标事件返回鼠标事件的坐标 (x,y)。为了在事件发生时执行操作,我们定义了一个鼠标回调函数。我们使用左键单击(cv2.EVENT_LBUTTONDOWN)和右键单击(cv2.EVENT_RBUTTONDOWN)来显示图像上点击点的坐标。
步骤
要显示输入图像上点击点的坐标,您可以按照以下步骤操作:
导入所需的库OpenCV。确保您已安装它。
定义一个鼠标回调函数来显示输入图像上点击点的坐标。当鼠标事件发生时,会执行鼠标回调函数。鼠标事件给出鼠标事件的坐标 (x, y)。这里我们定义一个鼠标回调函数,当执行鼠标左键单击 (EVENT_LBUTTONDOWN) 或右键单击 (EVENT_RBUTTONDOWN) 时,显示输入图像上点击点的坐标。在这个回调函数中,我们将坐标显示为文本,并将点显示为半径很小的圆。
使用cv2.imread()函数读取输入图像。
定义一个新窗口,并使用cv2.setMouseCallback()将上面定义的回调函数绑定到该窗口。
显示图像窗口。此窗口打开输入图像,我们在该图像上显示鼠标事件发生点的坐标。要关闭窗口,请按esc键。
让我们看一些程序示例,以便更好地理解。
输入图像
我们将在下面的示例中使用此图像作为输入文件。

示例
在下面的 Python 代码中,我们在执行图像上的左键单击 (EVENT_LBUTTONDOWN) 时显示点的坐标。我们还在图像上绘制这些点。
# import the required library
import cv2

# define a function to display the coordinates of

# of the points clicked on the image
def click_event(event, x, y, flags, params):
   if event == cv2.EVENT_LBUTTONDOWN:
      print(f'({x},{y})')

      # put coordinates as text on the image
      cv2.putText(img, f'({x},{y})',(x,y),
      cv2.FONT_HERSHEY_SIMPLEX, 1, (0, 0, 255), 2)

      # draw point on the image
      cv2.circle(img, (x,y), 3, (0,255,255), -1)

# read the input image
img = cv2.imread('back2school.jpg')

# create a window
cv2.namedWindow('Point Coordinates')

# bind the callback function to window
cv2.setMouseCallback('Point Coordinates', click_event)

# display the image
while True:
   cv2.imshow('Point Coordinates',img)
   k = cv2.waitKey(1) & 0xFF
   if k == 27:
      break
cv2.destroyAllWindows()
输出
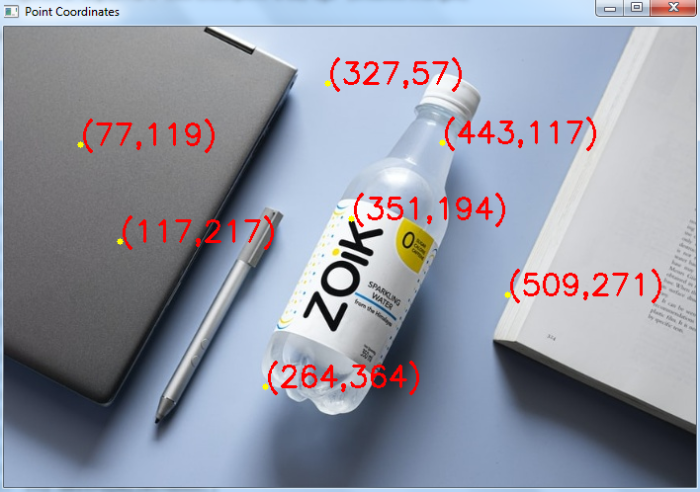
执行以上代码后,将产生以下输出:
(77,119)
(327,57)
(117,217)
(351,194)
(509,271)
(264,364)
(443,117)
我们得到以下窗口显示输出:

在上面的输出图像中,点以黄色绘制,点坐标以红色绘制。
示例
在此示例中,我们在执行图像上的左键单击 (EVENT_LBUTTONDOWN) 或右键单击 (EVENT_RBUTTONDOWN) 时显示点的坐标。我们还在图像上绘制这些点。
# import required library
import cv2

# function to display the coordinates of the points clicked on the image
def click_event(event, x, y, flags, params):

   # checking for left mouse clicks
   if event == cv2.EVENT_LBUTTONDOWN:
      print('Left Click')
      print(f'({x},{y})')

   # put coordinates as text on the image
   cv2.putText(img, f'({x},{y})', (x, y),   cv2.FONT_HERSHEY_SIMPLEX, 1, (255, 0, 0), 2)
   cv2.circle(img, (x, y), 3, (0, 0, 255), -1)
   if event == cv2.EVENT_RBUTTONDOWN:
      print('Right Click')
      print(f'({x},{y})')

      # put coordinates as text on the image
      cv2.putText(img, f'({x},{y})', (x, y),
      cv2.FONT_HERSHEY_SIMPLEX, 1, (0, 255, 255), 2)
      cv2.circle(img, (x, y), 3, (0, 0, 255), -1)

# read the input image
img = cv2.imread('back2school.jpg')

# create a window
cv2.namedWindow('Point Coordinates')

# bind the callback function to window
cv2.setMouseCallback('Point Coordinates', click_event)

# display the image
while True:
   cv2.imshow('Point Coordinates', img)
   k = cv2.waitKey(1) & 0xFF
   if k == 27:
      break
cv2.destroyAllWindows()
输出
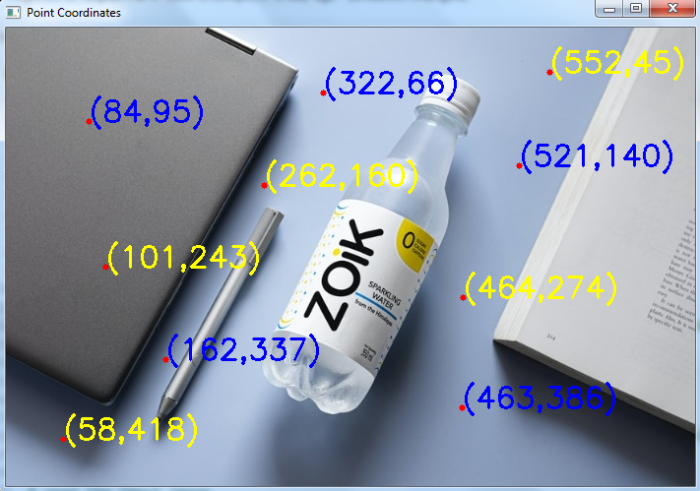
执行以上代码后,将产生以下输出。
Left Click
(84,95)
Left Click
(322,66)
Right Click
(262,160)
Right Click
(464,274)
Right Click
(552,45)
Left Click
(162,337)
Left Click
(521,140)
Right Click
(101,243)
Left Click
(463,386)
Right Click
(58,418)
我们得到以下窗口,显示输出:

在上面的输出图像中,点以红色绘制,点坐标(左键单击)以蓝色绘制,点坐标(右键单击)以黄色绘制。


 数据结构
数据结构 网络
网络 关系数据库管理系统
 操作系统
操作系统 Java
Java iOS
iOS HTML
HTML CSS
CSS Android
 Python
 C 编程
C 编程 C++
C++ C#
C# MongoDB
 MySQL
MySQL Javascript
 PHP
PHP