从NumPy数组绘制折线图
折线图是一种常用的显示两个相关数据集之间关系的方法。其主要用途是显示随时间的变化。要从NumPy数组绘制折线图,可以使用matplotlib,它是使用最广泛、历史最悠久的Python绘图库。它可以轻松地与NumPy集成,方便创建折线图以表示给定数据集中的趋势和模式。
从NumPy数组绘制折线图的Python程序
以下是一些示例程序,演示如何从NumPy数组绘制折线图。
示例1
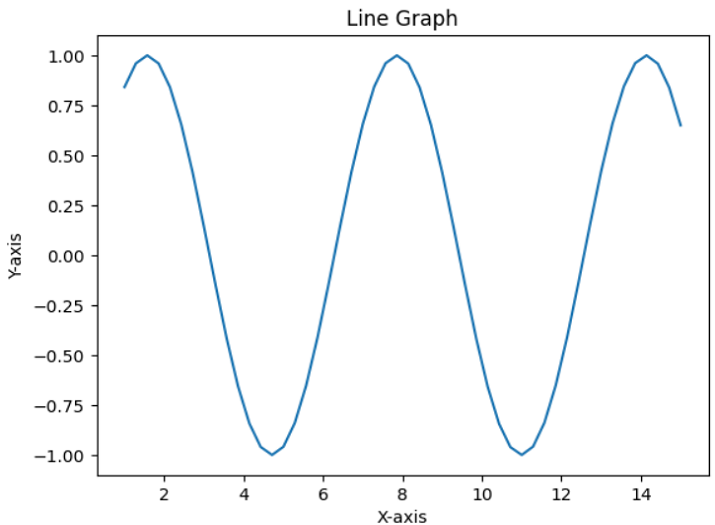
在这个程序中,我们将生成一个值范围为1到15的NumPy数组axisX,然后使用sin方法创建一个相应的数组axisY。为了绘制折线图,我们将使用plot()方法,并自定义图表标题以及x轴和y轴的标签。
# importing required packages
import numpy as np
import matplotlib.pyplot as plt
# To generate random data for plotting
axisX = np.linspace(1, 15, 50)
axisY = np.sin(axisX)
# To create the line graph from above data
plt.plot(axisX, axisY)
# Adding title and labels for the graph
plt.title('Line Graph')
plt.xlabel('X-axis')
plt.ylabel('Y-axis')
# to show the final graph
plt.show()
输出

示例2
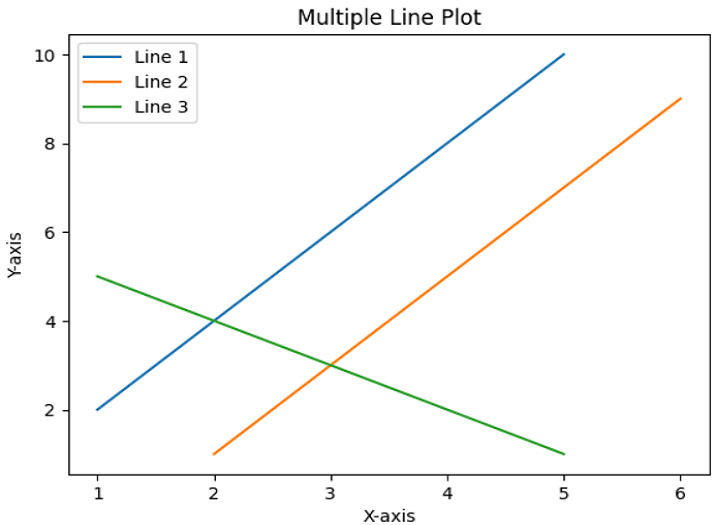
在这个示例中,我们将展示'plot()'方法在绘制多条线中的用法。
方法
导入NumPy库,引用名为'np',并从matplotlib库导入pyplot模块,并将其重命名为plt。
使用NumPy数组初始化三条线作为数据点。
使用'plot()'方法绘制x坐标值与y坐标值。
然后,使用'title'、'legend'、'xlabel'和'ylabel'添加一些关于绘图的信息。
使用'show()'方法显示结果并退出。
import numpy as np
import matplotlib.pyplot as plt
# Data points of line 1
x1 = np.array([1, 2, 3, 4, 5])
y1 = np.array([2, 4, 6, 8, 10])
# Data points of line 2
x2 = np.array([2, 3, 4, 5, 6])
y2 = np.array([1, 3, 5, 7, 9])
# Data points of line 3
x3 = np.array([1, 2, 3, 4, 5])
y3 = np.array([5, 4, 3, 2, 1])
# Plotting all lines with labels
plt.plot(x1, y1, label='Line 1')
plt.plot(x2, y2, label='Line 2')
plt.plot(x3, y3, label='Line 3')
# Adding legend, x and y labels, and title for the lines
plt.legend()
plt.xlabel('X-axis')
plt.ylabel('Y-axis')
plt.title('Multiple Line Plot')
# Displaying the plot
plt.show()
输出

示例3
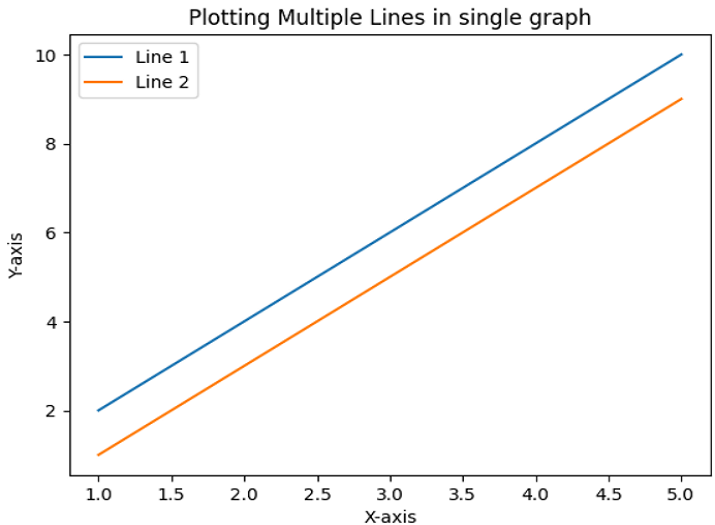
这是另一个示例,我们将使用与前一个示例相同的代码来绘制两条线而不是三条线。
import matplotlib.pyplot as plt
import numpy as np
# Data points of line 1
x1 = np.array([1, 2, 3, 4, 5])
y1 = np.array([2, 4, 6, 8, 10])
# Data points of line 2
x2 = np.array([1, 2, 3, 4, 5])
y2 = np.array([1, 3, 5, 7, 9])
# Plotting all lines with specifying labels
plt.plot(x1, y1, label='Line 1')
plt.plot(x2, y2, label='Line 2')
# Adding legend, x and y labels, and titles for the lines
plt.legend()
plt.xlabel('X-axis')
plt.ylabel('Y-axis')
plt.title('Plotting Multiple Lines in single graph')
# Displaying the plot
plt.show()
输出

结论
在本文中,我们看到了三个示例程序,它们展示了在从NumPy数组绘制折线图中plot()方法的用法。此方法在matplotlib库中可用。折线图是可视化复杂趋势和数据集的一种方法。

广告

 数据结构
数据结构 网络
网络 关系数据库管理系统 (RDBMS)
 操作系统
操作系统 Java
Java iOS
iOS HTML
HTML CSS
CSS Android
 Python
 C语言编程
C语言编程 C++
C++ C#
C# MongoDB
 MySQL
MySQL Javascript
 PHP
PHP