
 数据结构
数据结构 网络
网络 RDBMS
RDBMS 操作系统
操作系统 Java
Java iOS
iOS HTML
HTML CSS
CSS Android
 Python
 C 编程
C 编程 C++
C++ C#
C# MongoDB
 MySQL
MySQL JavaScript
 PHP
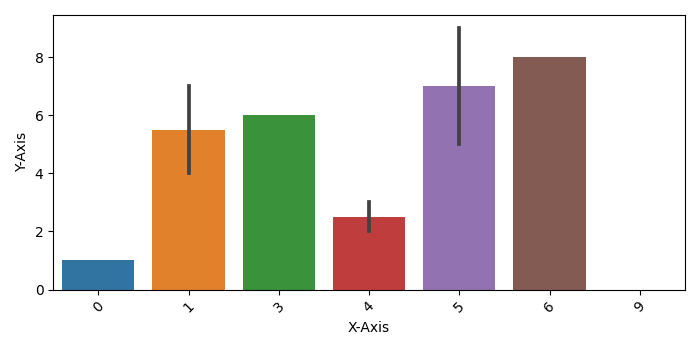
PHP使用 Seaborn 绘制 Pandas DataFrame 的多列
要使用 Seaborn 绘制 Pandas DataFrame 的多列,我们可以执行以下步骤:
使用 Pandas 制作一个数据框。
使用 Seaborn 的 barplot() 方法绘制一个条形图。
将 xticks 标签旋转 45 度。
使用 show() 方法显示图形。
示例
import pandas
import matplotlib.pylab as plt
import seaborn as sns
import numpy as np
plt.rcParams["figure.figsize"] = [7.00, 3.50]
plt.rcParams["figure.autolayout"] = True
df = pandas.DataFrame({"X-Axis": [np.random.randint(10) for i in range(10)], "YAxis": [i for i in range(10)]})
bar_plot = sns.barplot(x='X-Axis', y='Y-Axis', data=df)
plt.xticks(rotation=45)
plt.show()
输出

更新日期:2021 年 5 月 8 日
1K+ 浏览

广告