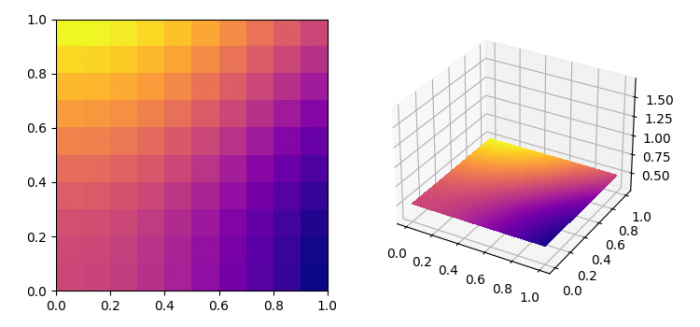
在 Matplotlib 中绘制 3d 中的 imshow() 图像
要在 Matplotlib 中绘制 3D 中的 imshow() 图像,我们可以执行以下步骤 −
使用 numpy 创建 xx 和 yy 数据点。
使用 X、Y 和 Z 获取数据 (2D)。
使用 figure() 方法创建新图形或激活现有图形。
将 'ax1' 作为子图排列的一部分添加到图形中。
以图像形式显示数据,即在具有数据的 2D 常规栅格上。
将 'ax2' 作为子图排列的一部分添加到图形中。
创建并存储一组等值线或填充区域。
要显示图形,请使用 show() 方法。
示例
import matplotlib.pyplot as plt
import numpy as np
from matplotlib import cm

plt.rcParams["figure.figsize"] = [7.50, 3.50]
plt.rcParams["figure.autolayout"] = True

xx, yy = np.meshgrid(np.linspace(0, 1, 10), np.linspace(0, 1, 10))

X = xx
Y = yy
Z = 10 * np.ones(X.shape)

data = np.cos(xx) * np.cos(xx) + np.sin(yy) * np.sin(yy)
fig = plt.figure()

ax1 = fig.add_subplot(121)
ax1.imshow(data, cmap="plasma", interpolation='nearest', origin='lower', extent=[0, 1, 0, 1])

ax2 = fig.add_subplot(122, projection='3d')
ax2.contourf(X, Y, data, 100, zdir='z', offset=0.5, cmap="plasma")

plt.show()
输出


广告

 数据结构
数据结构 网络
网络 RDBMS
RDBMS 操作系统
操作系统 Java
Java iOS
iOS HTML
HTML CSS
CSS Android
 Python
 C 编程
C 编程 C++
C++ C#
C# MongoDB
 MySQL
MySQL Javascript
 PHP
PHP