
 数据结构
数据结构 网络
网络 关系数据库管理系统
 操作系统
操作系统 Java
Java iOS
iOS HTML
HTML CSS
CSS Android
 Python
 C 编程
C 编程 C++
C++ C#
C# MongoDB
 MySQL
MySQL Javascript
 PHP
PHPPython Plotly:如何使用 Pandas 数据框定义 Sankey 图的结构?
Sankey 图用于通过定义“源”来表示源节点和“目标”来表示目标节点来可视化流程。它用于表示对象在不同数据点之间的流动。
在本教程中,让我们了解如何使用数据框定义 Sankey 图的结构。在这里,我们将使用plotly.graph_objects模块生成图形。它包含许多生成图表的方法。
步骤 1
导入plotly.graphs_objs模块并将其别名为go。
import plotly.graphs_objs as go
步骤 2
导入 Pandas 模块并将其别名为pd。
import pandas as pd
步骤 3
创建具有“id”、“label”和“color”坐标的二维节点列表 -
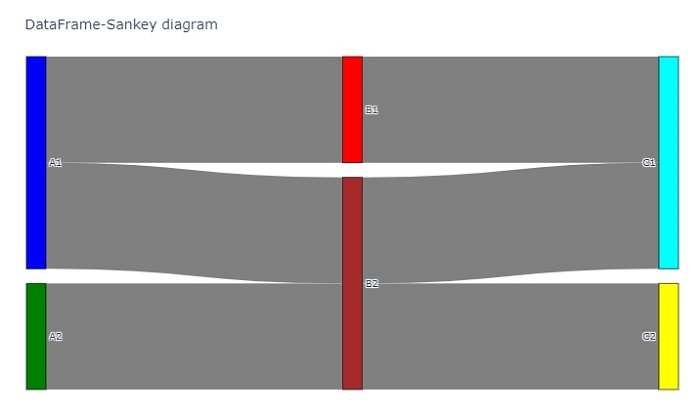
nodes = [
   ['id', 'label', 'color'],
   [ 0,    'A1',    'blue'],
   [ 1,    'A2',    'green'],
   [ 2,    'B1',    'red'],
   [ 3,    'B2',    'brown'],
   [ 4,    'C1',    'cyan'],
   [ 5,    'C2',    'yellow']
]
步骤 4
创建具有“source”、“target”、“value”和“link color”的二维链接列表,如下所示 -
links = [
   ['Source', 'Target', 'Value', 'Link Color'],
   [  0,          2,       4,       'grey'],
   [  0,          3,       4,       'grey'],
   [  1,          3,       4,       'grey'],
   [  2,          4,       4,       'grey'],
   [  3,          4,       4,       'grey'],
   [  3,          5,       4,       'grey']
]
步骤 5
计算节点和链接标题,并为节点和链接生成两个数据框。
nodes_headers = nodes.pop(0)
links_headers = links.pop(0)

df_nodes = pd.DataFrame(nodes, columns = nodes_headers)
df_links = pd.DataFrame(links, columns = links_headers)
步骤 6
接下来,创建 Sankey 图。将数据框节点添加到 Sankey 图中,并设置其颜色和粗细值。
fig = go.Figure(data=[go.Sankey(
   node = dict(
      pad = 15,
      thickness = 20,
      line = dict(color = "black", width = 0.5),
      label = df_nodes['label'].dropna(axis=0, how='any'),
      color = df_nodes['color']),
步骤 7
生成“source”、“target”、“value”和“link colors”的链接,如下所示 -
link = dict(
   source = df_links['Source'].dropna(axis=0, how='any'),
   target = df_links['Target'].dropna(axis=0, how='any'),
   value = df_links['Value'].dropna(axis=0, how='any'),
   color = df_links['Link Color'].dropna(axis=0, how='any'),
)
步骤 8
使用update_layout()方法设置 Sankey 图的标题。最后,使用fig.show()显示图表。
fig.update_layout(
   title_text="DataFrame-Sankey diagram",
   font_size=10
)
fig.show()
示例
使用 Pandas 数据框定义 Sankey 图结构的完整代码如下所示 -
import plotly.graph_objects as go
import pandas as pd
nodes = [
   ['id', 'label', 'color'],
   [0, 'A1', 'blue'],
   [1, 'A2', 'green'],
   [2, 'B1', 'red'],
   [3, 'B2', 'brown'],
   [4, 'C1', 'cyan'],
   [5, 'C2', 'yellow']
]
links = [
   ['Source', 'Target', 'Value', 'Link Color'],
   [0, 2, 4, 'grey'],
   [0, 3, 4, 'grey'],
   [1, 3, 4, 'grey'],
   [2, 4, 4, 'grey'],
   [3, 4, 4, 'grey'],
   [3, 5, 4, 'grey']
]

# Retrieve headers and build dataframes
nodes_headers = nodes.pop(0)
links_headers = links.pop(0)

df_nodes = pd.DataFrame(nodes, columns=nodes_headers)
df_links = pd.DataFrame(links, columns=links_headers)

fig = go.Figure(data=[go.Sankey(
   node = dict(
      pad = 15,
      thickness = 20,
      line = dict(color = "black", width = 0.5),
      label = df_nodes['label'].dropna(axis=0, how='any'),
      color = df_nodes['color']
   ),

   link = dict(
      source=df_links['Source'].dropna(axis=0, how='any'),
      target=df_links['Target'].dropna(axis=0, how='any'),
      value=df_links['Value'].dropna(axis=0, how='any'),
      color=df_links['Link Color'].dropna(axis=0, how='any'),
   )
)])

fig.update_layout(
   title_text="DataFrame-Sankey diagram",
   font_size=10
)

fig.show()
输出
执行后,它将在浏览器上显示以下输出 -

更新于:2022 年 10 月 21 日
3K+ 浏览量

广告