- Seaborn 教程
- Seaborn - 首页
- Seaborn - 简介
- Seaborn - 环境设置
- 导入数据集和库
- Seaborn - 图表美学
- Seaborn - 调色板
- Seaborn - 直方图
- Seaborn - 核密度估计
- 可视化成对关系
- Seaborn - 绘制分类数据
- 观测数据的分布
- Seaborn - 统计估计
- Seaborn - 绘制宽格式数据
- 多面板分类图
- Seaborn - 线性关系
- Seaborn - Facet Grid
- Seaborn - Pair Grid
- 函数参考
- Seaborn - 函数参考
- Seaborn 有用资源
- Seaborn - 快速指南
- Seaborn - 有用资源
- Seaborn - 讨论
Seaborn - 绘制分类数据
在我们之前的章节中,我们学习了散点图、六边形图和kde图,这些图用于分析所研究的连续变量。当所研究的变量是分类变量时,这些图不适用。
当一个或两个研究变量是分类变量时,我们使用stripplot()、swarmplot()等图。Seaborn 提供了这样的接口。
分类散点图
在本节中,我们将学习分类散点图。
stripplot()
当所研究的变量之一是分类变量时,使用stripplot()。它以排序的方式沿着任何一个轴表示数据。
示例
import pandas as pd
import seaborn as sb
from matplotlib import pyplot as plt
df = sb.load_dataset('iris')
sb.stripplot(x = "species", y = "petal_length", data = df)
plt.show()
输出

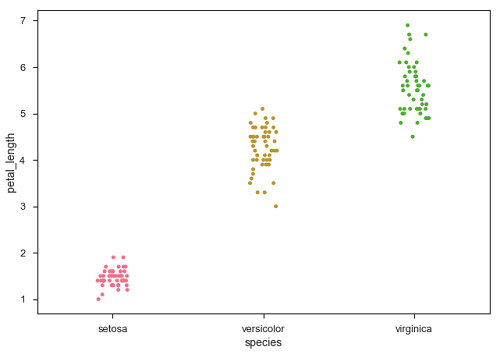
在上图中,我们可以清楚地看到每个物种的petal_length差异。但是,上述散点图的主要问题是散点图上的点重叠了。我们使用“Jitter”参数来处理这种情况。
Jitter 为数据添加一些随机噪声。此参数将调整沿分类轴的位置。
示例
import pandas as pd
import seaborn as sb
from matplotlib import pyplot as plt
df = sb.load_dataset('iris')
sb.stripplot(x = "species", y = "petal_length", data = df, jitter = Ture)
plt.show()
输出

现在,可以很容易地看到点的分布。
Swarmplot()
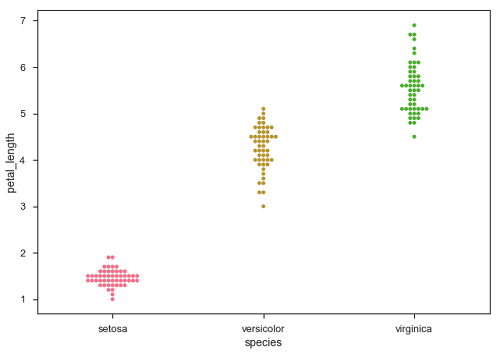
另一个可以作为“Jitter”替代方案的选项是函数swarmplot()。此函数将每个散点图点定位在分类轴上,从而避免点重叠。
示例
import pandas as pd
import seaborn as sb
from matplotlib import pyplot as plt
df = sb.load_dataset('iris')
sb.swarmplot(x = "species", y = "petal_length", data = df)
plt.show()
输出

广告