
 数据结构
数据结构 网络
网络 关系型数据库管理系统
 操作系统
操作系统 Java
Java iOS
iOS HTML
HTML CSS
CSS Android
 Python
 C 编程
C 编程 C++
C++ C#
C# MongoDB
 MySQL
MySQL Javascript
 PHP
PHP使用 Python 进行机器学习的宇宙飞船泰坦尼克号项目
机器学习中最初的泰坦尼克号项目旨在确定泰坦尼克号上的人是否会幸存下来。但是,这个名为宇宙飞船泰坦尼克号的项目略有不同。
这里的问题陈述是,一艘宇宙飞船载着人们进行太空旅行。但由于发生碰撞,一些人需要被运送到另一个维度或星球。现在这不能随机进行。因此,我们将使用 Python 中的机器学习技术来找出谁将被运送,谁将不被运送。
算法
步骤 1 − 导入 numpy、pandas、matplotlib、seaborn 和 sklearn 等库,并将数据集加载为 pandas 数据框。
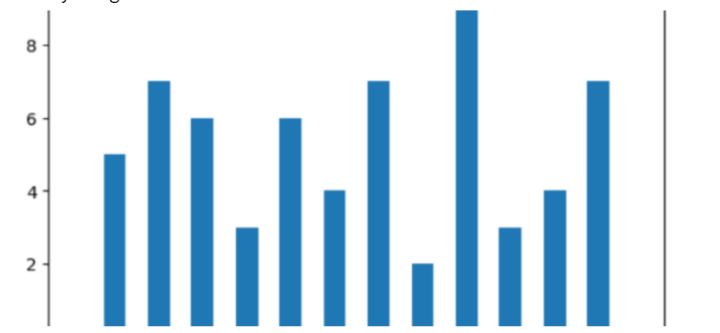
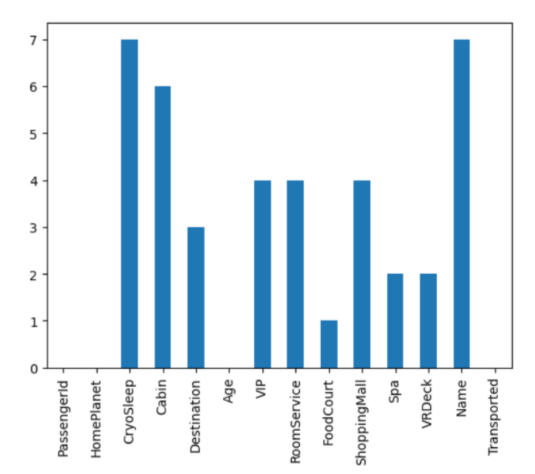
步骤 2 − 为了清理数据,首先绘制条形图以检查空值。如果发现空值,则查找各个特征之间的关系并填充空值。在填充值之前检查异常值,如果需要。
步骤 3 − 再次检查空值。这次,使用朴素值填充所有空值。在此步骤中,您应该获得 0 作为输出,这意味着所有空值都已处理。
步骤 4 − 提取、减少、合并或添加特征以导出重要且最显著的信息。这是通过重复比较和相关操作完成的。
步骤 5 − 为了找出进一步的关系,使用 EDA 或探索性数据分析,我们利用可视化工具来查看不同特征之间的关系。我们将制作饼图、条形图和热图,以查看是否存在任何高度相关的特征。
步骤 6 − 将数据集拆分为测试集和训练集,并使用 StandardScaler 对数据进行标准化。
步骤 7 − 现在在这个数据上训练一些机器学习模型,并检查哪个模型最合适。我们正在使用逻辑回归、XGBClassifier 和 SVC。
步骤 8 − 选择性能最佳的模型。
步骤 9 − 使用所选模型打印混淆矩阵和验证数据。
示例
在这个例子中,我们将使用一个宇宙飞船泰坦尼克号数据集,您可以在此处找到它,然后,我们将执行预测一个人是否将从宇宙飞船运送到不同的星球或维度所需的各种步骤。请注意,我们没有采用所有行,因为它是一个巨大的数据集,但您可以根据需要采用任意多行。
#part 1
#--------------------------------------------------------------------
#setting up libraries and dataset
#Import the required libraries
import numpy as np
import pandas as pd
import matplotlib.pyplot as plt
import seaborn as sb
import sklearn
from sklearn.model_selection import train_test_split
from sklearn.preprocessing import LabelEncoder, StandardScaler
from sklearn import metrics
from sklearn.svm import SVC
from xgboost import XGBClassifier
from sklearn.linear_model import LogisticRegression
from sklearn.metrics import ConfusionMatrixDisplay
from sklearn.metrics import confusion_matrix
import warnings
warnings.filterwarnings('ignore')
#load and print the dataset
df = pd.read_csv('titanic_dataset.csv')
df.head()
#print other information about the dataset
df.shape
df.info()
df.describe()
#part 2
#--------------------------------------------------------------------
#preprocessing the data
#find the null values
df.isnull().sum().plot.bar()
plt.show()
#substitute the null values as needed
col = df.loc[:,'RoomService':'VRDeck'].columns
df.groupby('VIP')[col].mean()
df.groupby('CryoSleep')[col].mean()
temp = df['CryoSleep'] == True
df.loc[temp, col] = 0.0
for c in col:
for val in [True, False]:
temp = df['VIP'] == val
k = df[temp].mean()
df.loc[temp, c] = df.loc[temp, c].fillna(k)
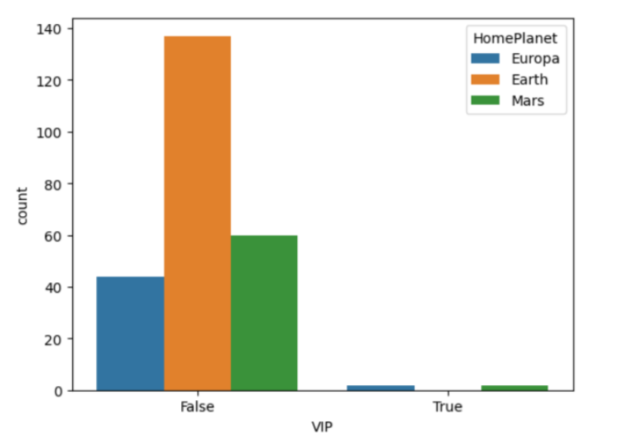
#check relationship bw VIP and HomePlanet feature
sb.countplot(data=df, x='VIP',
hue='HomePlanet')
plt.show()
col = 'HomePlanet'
temp = df['VIP'] == False
df.loc[temp, col] = df.loc[temp, col].fillna('Earth')
temp = df['VIP'] == True
df.loc[temp, col] = df.loc[temp, col].fillna('Europa')
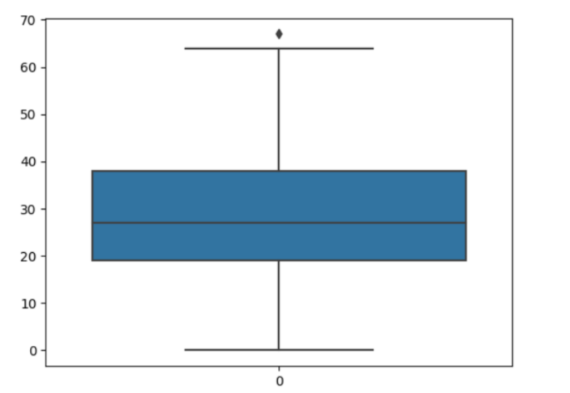
#check for outliers
sb.boxplot(df['Age'])
plt.show()
#exclude outliers while substituting null values
temp = df[df['Age'] < 61]['Age'].mean()
df['Age'] = df['Age'].fillna(temp)
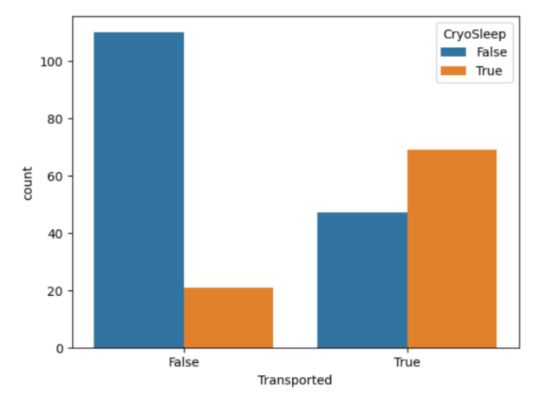
#check relationship between Transported and CryoSleep
sb.countplot(data=df,
x='Transported',
hue='CryoSleep')
plt.show()
#check for the null values again
df.isnull().sum().plot.bar()
plt.show()
#fill them all with the naive method
for col in df.columns:
if df[col].isnull().sum() == 0:
continue
if df[col].dtype == object or df[col].dtype == bool:
df[col] = df[col].fillna(df[col].mode()[0])
else:
df[col] = df[col].fillna(df[col].mean())
#this should return 0, meaning no null values are left
df.isnull().sum().sum()
#part 3
#--------------------------------------------------------------------
#feature engineering
#passenger id and room no represent the same kind of information
new = df["PassengerId"].str.split("_", n=1, expand=True)
df["RoomNo"] = new[0].astype(int)
df["PassengerNo"] = new[1].astype(int)
df.drop(['PassengerId', 'Name'],
axis=1, inplace=True)
#filling room no with max passengers
data = df['RoomNo']
for i in range(df.shape[0]):
temp = data == data[i]
df['PassengerNo'][i] = (temp).sum()
#removing roomno
df.drop(['RoomNo'], axis=1,
inplace=True)
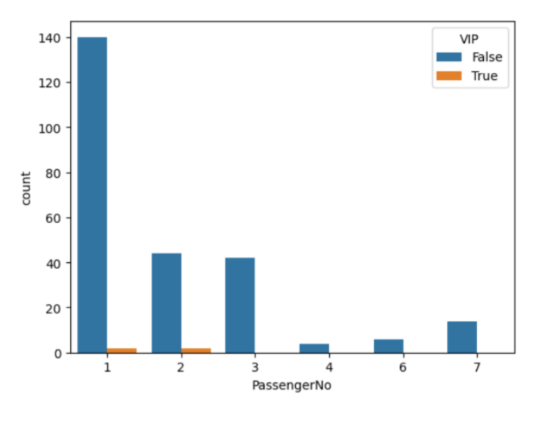
sb.countplot(data=df,
x = 'PassengerNo',
hue='VIP')
plt.show()
#not much relation in VIP sharing a room
new = df["Cabin"].str.split("/", n=2, expand=True)
data["F1"] = new[0]
df["F2"] = new[1].astype(int)
df["F3"] = new[2]
df.drop(['Cabin'], axis=1,
inplace=True)
#combining all expenses
df['LeasureBill'] = df['RoomService'] + df['FoodCourt']\
+ df['ShoppingMall'] + df['Spa'] + df['VRDeck']
#part 4
#--------------------------------------------------------------------
#EDA
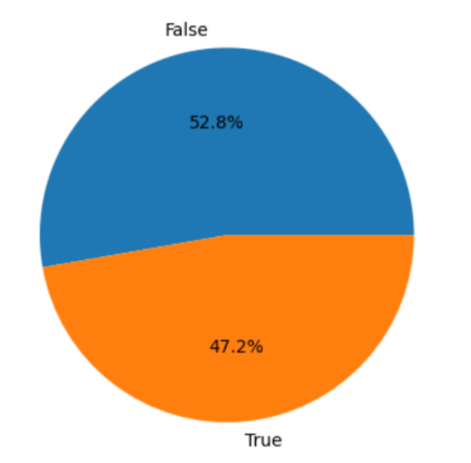
#checking if the data is balanced
x = df['Transported'].value_counts()
plt.pie(x.values,
labels=x.index,
autopct='%1.1f%%')
plt.show()
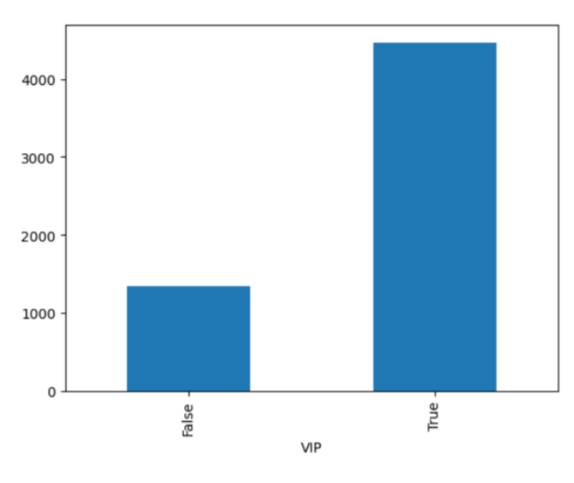
#relation bw VIP and leasureBill
df.groupby('VIP').mean()['LeasureBill'].plot.bar()
plt.show()
#encoding and binary conversion
for col in df.columns:
if df[col].dtype == object:
le = LabelEncoder()
df[col] = le.fit_transform(df[col])
if df[col].dtype == 'bool':
df[col] = df[col].astype(int)
df.head()
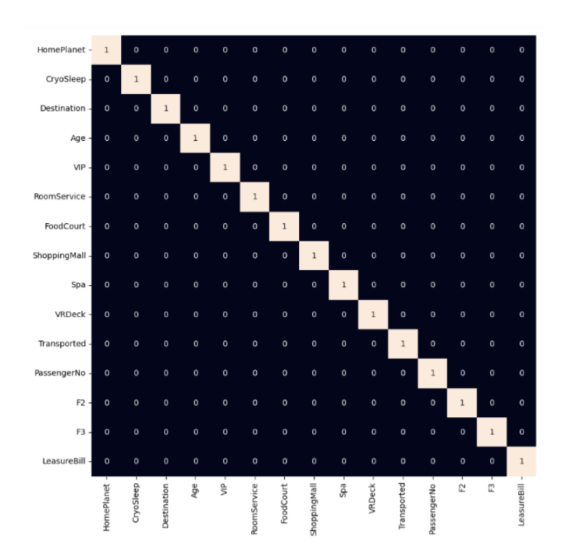
#checking correlated features with a heatmap
plt.figure(figsize=(10,10))
sb.heatmap(df.corr()>0.8,
annot=True,
cbar=False)
plt.show()
#part 5
#--------------------------------------------------------------------
#model training
#split the data
features = df.drop(['Transported'], axis=1)
target = df.Transported
X_train, X_val,\
Y_train, Y_val = train_test_split(features, target,
test_size=0.1,
random_state=22)
X_train.shape, X_val.shape
#normalize the data
scaler = StandardScaler()
X_train = scaler.fit_transform(X_train)
X_val = scaler.transform(X_val)
#check fitting with various ML models
from sklearn.metrics import roc_auc_score as ras
models = [LogisticRegression(), XGBClassifier(),
SVC(kernel='rbf', probability=True)]
for i in range(len(models)):
models[i].fit(X_train, Y_train)
print(f'{models[i]} : ')
train_preds = models[i].predict_proba(X_train)[:, 1]
print('Training Accuracy : ', ras(Y_train, train_preds))
val_preds = models[i].predict_proba(X_val)[:, 1]
print('Validation Accuracy : ', ras(Y_val, val_preds))
print()
#part 6
#--------------------------------------------------------------------
#model evaluation
#plot confusion matrix using the best model
y_pred = models[1].predict(X_val)
cm = confusion_matrix(Y_val, y_pred)
disp = ConfusionMatrixDisplay(confusion_matrix=cm)
disp.plot()
plt.show()
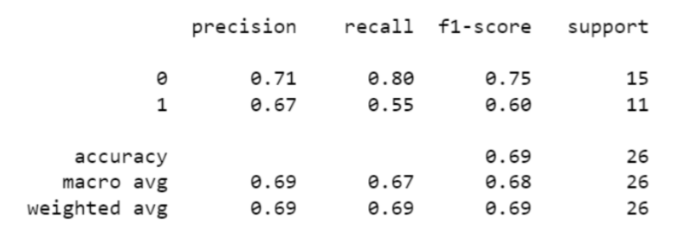
print(metrics.classification_report
(Y_val, models[1].predict(X_val)))
一旦所有库都导入,数据集就会加载到一个数据框中,其中数据集被处理以处理缺失值和异常值。随后,识别数据集中空值,并创建条形图以可视化每列中空值的计数,并绘制传输和冷冻睡眠之间的关系。
PassengerId 列被拆分为两列:RoomNo 和 PassengerNo,然后将这些列中的值转换为整数。目标变量 Transported 的平衡作为饼图绘制,VIP 和 LeasureBill 之间的关系也作为条形图显示。
在后面的部分,对数据集执行标签编码和二进制转换,以将分类列转换为数值。然后,创建一个热图以可视化数据集中特征之间的关系。
然后,每个模型都在训练集上进行训练,并使用 roc_auc_score 变量评估验证准确性。之后,绘制混淆矩阵以及分类报告(包括精确度)、F1 分数和报告,使用模型打印。
输出
<class 'pandas.core.frame.DataFrame'>
RangeIndex: 254 entries, 0 to 253
Data columns (total 14 columns):
 #   Column        Non-Null Count  Dtype
---  ------        --------------  -----
 0   PassengerId   254 non-null    object
 1   HomePlanet    249 non-null    object
 2   CryoSleep     247 non-null    object
 3   Cabin         248 non-null    object
 4   Destination   251 non-null    object
 5   Age           248 non-null    float64
 6   VIP           250 non-null    object
 7   RoomService   247 non-null    float64
 8   FoodCourt     252 non-null    float64
 9   ShoppingMall  242 non-null    float64
 10  Spa           251 non-null    float64
 11  VRDeck        250 non-null    float64
 12  Name          247 non-null    object
 13  Transported   254 non-null    bool
dtypes: bool(1), float64(6), object(7)
memory usage: 26.2+ KB
LogisticRegression() −
Training Accuracy :  0.8922982036851439
Validation Accuracy :  0.8060606060606061
XGBClassifier() −
Training Accuracy :  1.0
Validation Accuracy :  0.7454545454545454
SVC(probability=True) −
Training Accuracy :  0.9266825996453628
Validation Accuracy :  0.7878787878787878
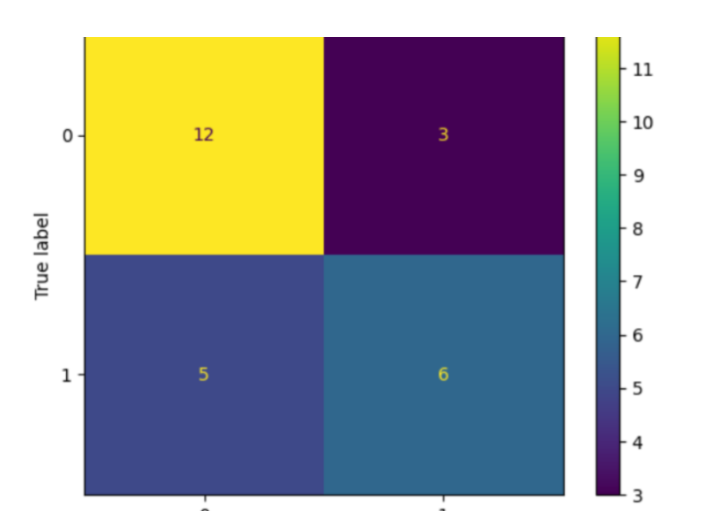
使用性能矩阵,您可以得出结论,该模型能够轻松地将正值预测为正值,但负值并非如此。
结论
为了完成这个宇宙飞船泰坦尼克号项目,您还可以使用其他模型,如 K 最近邻 (KNN)、支持向量机 (SVM)、随机森林 (RF) 和朴素贝叶斯等。此外,我们在这里自己预处理了数据。但是,您可以使用互联网上提供的其他已预处理的数据集。这将为我们节省许多步骤,并使我们的任务更容易。

274 次查看
