Angular Google Charts - 基本气泡图
以下是基本气泡图的示例。
我们在 Google Charts 配置语法 章节中已经了解了如何使用配置来绘制图表。现在,我们来看一个气泡图示例。
配置
我们使用了 **BubbleChart** 类来显示基本气泡图。
type = 'BubbleChart';
示例
app.component.ts
import { Component } from '@angular/core';
@Component({
selector: 'app-root',
templateUrl: './app.component.html',
styleUrls: ['./app.component.css']
})
export class AppComponent {
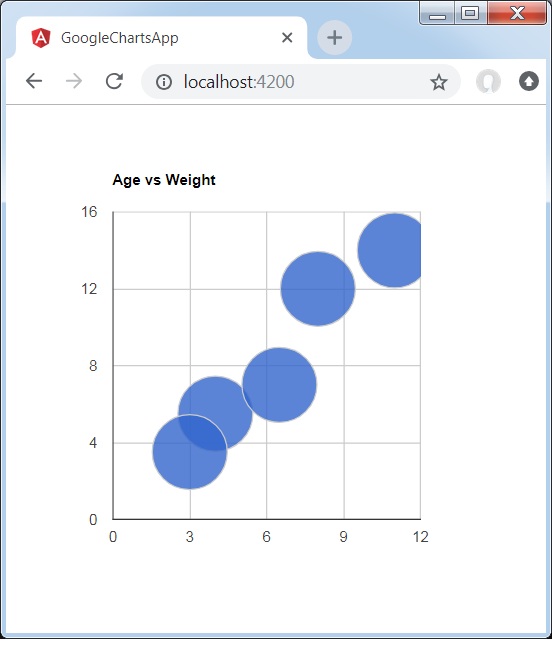
title = 'Age vs Weight';
type = 'BubbleChart';
data = [
["", 8, 12],
["", 4, 5.5],
["", 11, 14],
["", 3, 3.5],
["", 6.5, 7]
];
columnNames = ['Id', 'Age','Weight'];
options = { };
width = 550;
height = 400;
}
结果
验证结果。
angular_googlecharts_bubble_charts.htm
广告