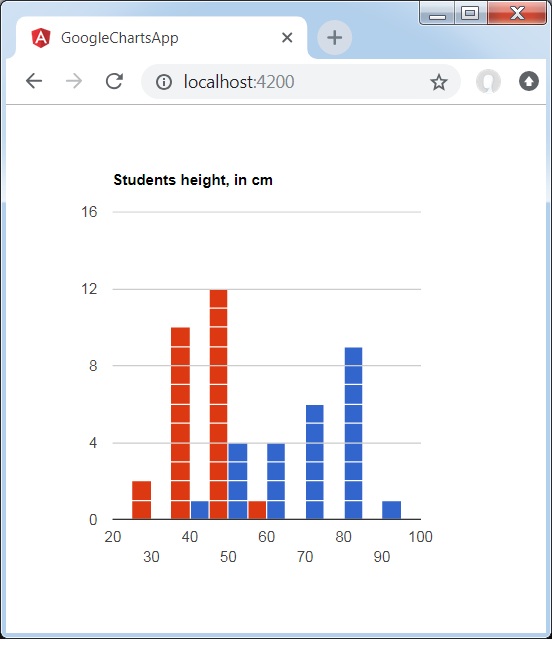
带有多系列的直方图
以下是带有多个系列的直方图示例。
我们已经在 Google 图表配置语法 章节中了解了用于绘制图表的配置。现在,让我们看一个带有多个系列的直方图示例。
示例
app.component.ts
import { Component } from '@angular/core';
@Component({
   selector: 'app-root',
   templateUrl: './app.component.html',
   styleUrls: ['./app.component.css']
})
export class AppComponent {
   title = 'Students height, in cm';
   type = 'Histogram';
   data = [
      ["1", 80, 40],["2", 55, 30],["3", 68, 34],["4", 80, 40],["5", 54, 27],
      ["6", 70, 35],["7", 85, 42],["8", 78, 40],["9", 70, 35],["10", 58, 28],
      ["11", 90, 45],["12", 65, 33],["13", 88, 50],["14", 82, 41],["15", 65, 30],
      ["16", 86, 43],["17", 45, 30],["18", 62, 30],["19", 84, 42],["20", 75, 40],
      ["21", 82, 41],["22", 75, 40],["23", 58, 30],["24", 70, 35],["25", 85, 40]
   ];
   columnNames = ["Student Roll No", "height", "weight"];
   options = {
      legend:'none'
   };
   width = 550;
   height = 400;
}
结果
验证结果。

angular_googlecharts_histogram_charts.htm
广告