堆叠阶梯图
以下是一个堆叠阶梯图示例。
我们已经在 Google Charts 配置语法 章节中看到了用于绘制图表的配置。现在,让我们看一个堆叠阶梯图示例。
配置
我们已经使用 isStacked 配置将阶梯图显示为堆叠图。
options = {
   isStacked:true
};
示例
app.component.ts
import { Component } from '@angular/core';
@Component({
selector: 'app-root',
templateUrl: './app.component.html',
styleUrls: ['./app.component.css']
})
export class AppComponent {
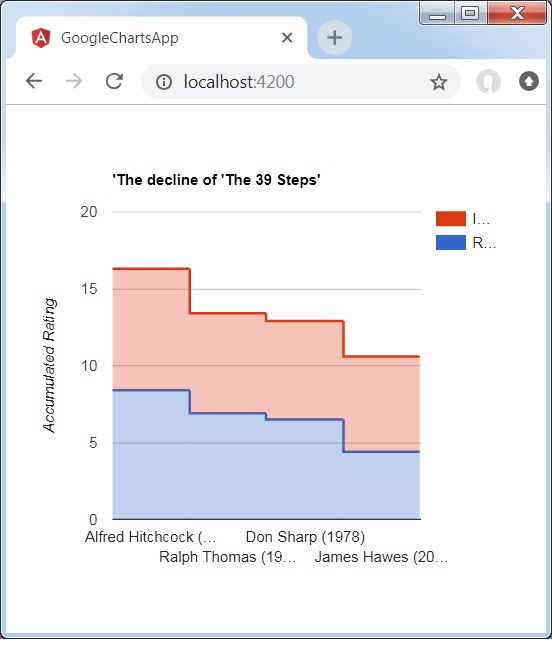
title = "'The decline of 'The 39 Steps'";
type = 'SteppedAreaChart';
data = [
["Alfred Hitchcock (1935)", 8.4, 7.9],
["Ralph Thomas (1959)", 6.9, 6.5],
["Don Sharp (1978)", 6.5, 6.4],
["James Hawes (2008)", 4.4, 6.2]
];
columnNames = ['Director (Year)', 'Rotten Tomatoes','IMDB'];
options = {
vAxis:{
title:'Accumulated Rating'
},
isStacked:true
};
width = 550;
height = 400;
}
结果
验证结果。
angular_googlecharts_stepped_charts.htm
广告