
 数据结构
数据结构 网络
网络 RDBMS
RDBMS 操作系统
操作系统 Java
Java iOS
iOS HTML
HTML CSS
CSS Android
 Python
 C 程序
C 程序 C++
C++ C#
C# MongoDB
 MySQL
MySQL Javascript
 PHP
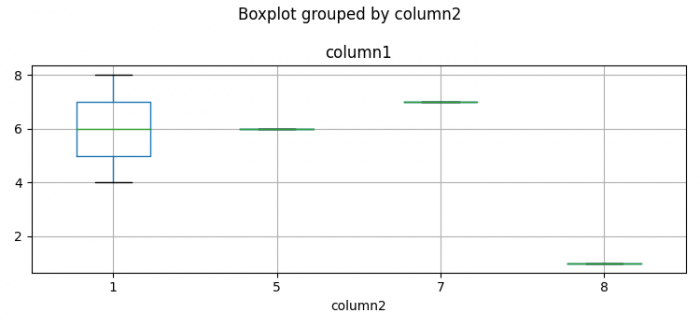
PHP用 Python Pandas 绘制分层箱线图
要创建分层箱线图,我们可以在 Python 类中执行以下步骤 -
步骤
设置图形大小并调整子图之间的内边距和周围的内边距。
创建一个二维、大小可变、可能有异构表的 Pandas 数据框。
计算一组数据的直方图。
创建一个按列分层的箱线图。
要显示图形,请使用 **show()** 方法。
示例
import pandas as pd
import numpy as np
from matplotlib import pyplot as plt

# Set the figure size
plt.rcParams["figure.figsize"] = [7.50, 3.50]
plt.rcParams["figure.autolayout"] = True

# Pandas dataframe
df = pd.DataFrame({"column1": [4, 6, 7, 1, 8], "column2": [1, 5, 7, 8, 1]})

# Compute the histogram
_, breaks = np.histogram(df.column1, bins=5)

# Create the boxplot
ax = df.boxplot(column='column1', by='column2')

# Display the plot
plt.show()
输出
它将产生以下输出 -

更新于:02-02-2022
399 次浏览

广告