- GWT Google Charts 教程
- GWT Google Charts - 首页
- GWT Google Charts - 概览
- 环境设置
- 配置语法
- GWT Google Charts - 区域图表
- GWT Google Charts - 条形图表
- GWT Google Charts - 气泡图表
- GWT Google Charts - 蜡烛图
- GWT Google Charts - 柱形图表
- GWT Google Charts - 组合图
- GWT Google Charts - 直方图
- GWT Google Charts - 折线图
- GWT Google Charts - 地图
- GWT Google Charts - 组织
- GWT Google Charts - 饼状图
- GWT Google Charts - 桑基图
- GWT Google Charts - 散点图
- GWT Google Charts - 阶梯状区域图
- GWT Google Charts - 表格图
- GWT Google Charts - 树状图
- GWT Google Charts 资源
- GWT Google Charts - 快速指南
- GWT Google Charts - 资源
- GWT Google Charts - 讨论
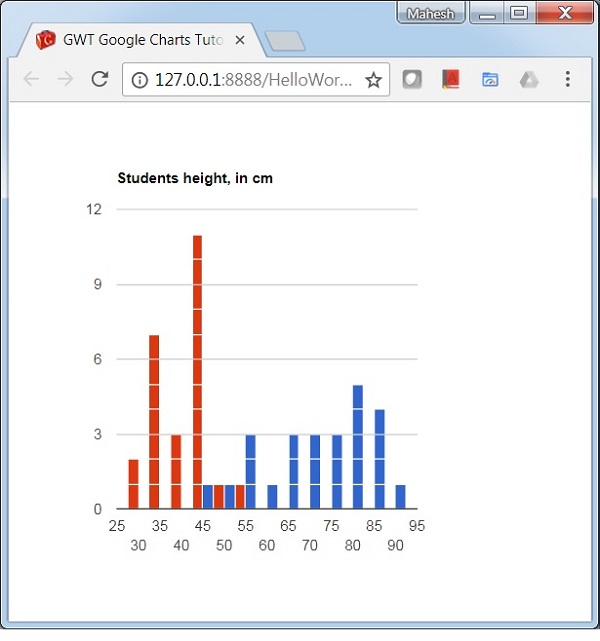
带有多个序列的直方图图表
以下是一个带有多个序列的直方图图表的示例。
我们已经在“Google Charts 配置语法”章节中了解用于绘制图表时使用的配置。现在,我们来看一个带有多个序列的直方图图表示例。
示例
HelloWorld.java
package com.tutorialspoint.client;

import com.google.gwt.core.client.EntryPoint;
import com.google.gwt.user.client.ui.RootPanel;

import com.googlecode.gwt.charts.client.ChartLoader;
import com.googlecode.gwt.charts.client.ChartPackage;
import com.googlecode.gwt.charts.client.DataTable;
import com.googlecode.gwt.charts.client.corechart.Histogram;
import com.googlecode.gwt.charts.client.corechart.HistogramOptions;
import com.googlecode.gwt.charts.client.options.Legend;
import com.googlecode.gwt.charts.client.options.LegendPosition;
import com.googlecode.gwt.charts.client.util.ChartHelper;

public class HelloWorld implements EntryPoint {
   private Histogram chart;

   private void initialize() {
      ChartLoader chartLoader = new ChartLoader(ChartPackage.CORECHART);
      chartLoader.loadApi(new Runnable() {
         public void run() {
            // Create and attach the chart
            chart = new Histogram();
            RootPanel.get().add(chart);
            draw();
         }
      });
   }
   private void draw() {
      // Prepare the data
      Object[][] data = new Object[][] { { "Student Roll No", "Height", "Weight" },
         {"1", 80, 40},{"2", 55, 30},{"3", 68, 34},{"4", 80, 40},{"5", 54, 27},
         {"6", 70, 35},{"7", 85, 42},{"8", 78, 40},{"9", 70, 35},{"10", 58, 28},
         {"11", 90, 45},{"12", 65, 33},{"13", 88, 50},{"14", 82, 41},{"15", 65, 30},
         {"16", 86, 43},{"17", 45, 30},{"18", 62, 30},{"19", 84, 42},{"20", 75, 40},
         {"21", 82, 41},{"22", 75, 40},{"23", 58, 30},{"24", 70, 35},{"25", 85, 40}
      };
      DataTable dataTable = ChartHelper.arrayToDataTable(data);

      // Set options
      HistogramOptions options = HistogramOptions.create();
      options.setTitle("Students height, in cm");
      options.setLegend(Legend.create(LegendPosition.NONE));
      options.setBucketSize(5);

      // Draw the chart
      chart.draw(dataTable,options);
      chart.setWidth("400px");
      chart.setHeight("400px");
   }
   public void onModuleLoad() {
      initialize();
   }
}
结果
验证结果。
gwt_googlecharts_histogram_charts.htm
广告