
 数据结构
数据结构 网络
网络 关系数据库管理系统 (RDBMS)
 操作系统
操作系统 Java
Java iOS
iOS HTML
HTML CSS
CSS Android
 Python
 C语言编程
C语言编程 C++
C++ C#
C# MongoDB
 MySQL
MySQL Javascript
 PHP
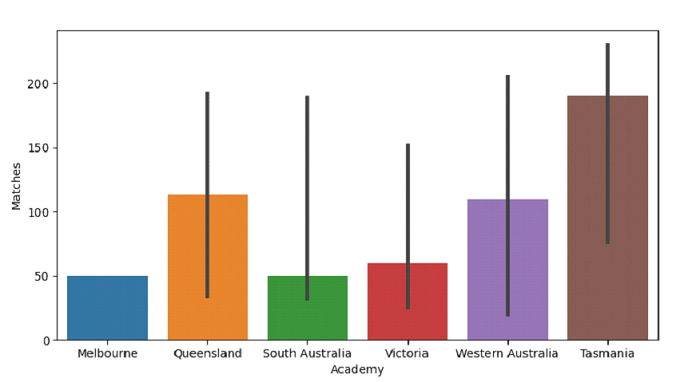
PHPPython Pandas - 绘制条形图并使用中位数作为集中趋势的估计值
Seaborn中的条形图用于显示点估计和置信区间作为矩形条。为此使用seaborn.barplot()。绘制具有数据集列作为x和y值的水平条形图。使用**estimator**参数将**中位数**设置为集中趋势的估计值。
假设以下数据集以CSV文件的形式给出:Cricketers2.csv
首先,导入所需的库:
import seaborn as sb
import pandas as pd
import matplotlib.pyplot as plt
from numpy import median
将数据从CSV文件加载到Pandas DataFrame中:
dataFrame = pd.read_csv("C:\Users\amit_\Desktop\Cricketers2.csv")
使用estimator参数将中位数设置为集中趋势的估计值,绘制使用比赛和学院的水平条形图:
sb.barplot(x = dataFrame["Academy"], y = dataFrame["Matches"], estimator = median)
示例
以下是代码:
import seaborn as sb
import pandas as pd
import matplotlib.pyplot as plt
from numpy import median

# Load data from a CSV file into a Pandas DataFrame
dataFrame = pd.read_csv("C:\Users\amit_\Desktop\Cricketers2.csv")

# plotting horizontal bar plots with Matches and Academy
# using the estimator parameter to set median as the estimate of central tendency
sb.barplot(x = dataFrame["Academy"], y = dataFrame["Matches"], estimator = median)

# display
plt.show()
输出
这将产生以下输出:

更新于:2021年9月29日
2K+ 次浏览

广告