
 数据结构
数据结构 网络
网络 RDBMS
RDBMS 操作系统
操作系统 Java
Java iOS
iOS HTML
HTML CSS
CSS Android
 Python
 C 编程
C 编程 C++
C++ C#
C# MongoDB
 MySQL
MySQL Javascript
 PHP
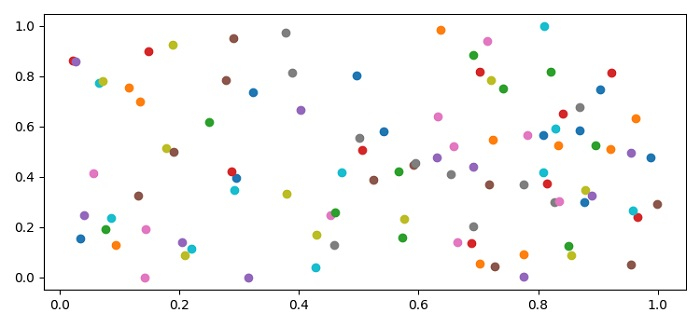
PHPPython 散点图,每个 X 具有多个 Y 值
要为每个 X 绘制具有多个 Y 值的散点图,我们可以使用 numpy 创建 x 和 y 数据点,将它们组合并迭代以创建散点图。
步骤
设置图形大小并调整子图之间和周围的填充。
使用 numpy 创建随机 xs 和 ys 数据点。
对 xs 和 ys 进行组合。迭代这些组合。
绘制每个 x 和 y 值的散点图。
使用 show() 方法显示图形。
示例
import numpy as np
from matplotlib import pyplot as plt
plt.rcParams["figure.figsize"] = [7.50, 3.50]
plt.rcParams["figure.autolayout"] = True
xs = np.random.rand(100)
ys = np.random.rand(100)
for x, y in zip(xs, ys):
   plt.scatter(x, y, cmap="copper")
plt.show()
输出

更新时间:01-Jun-2021
8K+ 阅读量

广告