
 数据结构
数据结构 网络
网络 RDBMS
RDBMS 操作系统
操作系统 Java
Java iOS
iOS HTML
HTML CSS
CSS Android
 Python
 C 编程
C 编程 C++
C++ C#
C# MongoDB
 MySQL
MySQL Javascript
 PHP
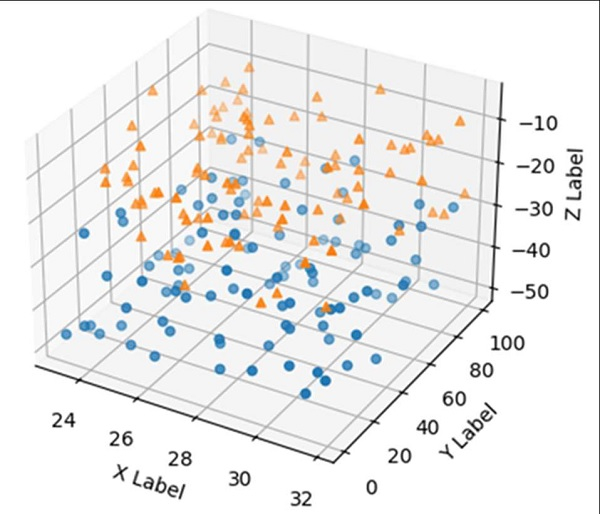
PHP如何用 Python 制作 3D 散点图?
为了获得 3D 图形,我们可以使用 fig.add_subplot(111, projection='3d') 方法实例化轴。然后,我们可以使用 scatter 方法在 x、y 和 z 轴上绘制不同的数据点。
步骤
新建一个图形或激活一个现成的图形。
将一个 `~.axes.Axes` 添加到图形中,作为子图形排列的一部分,其中 nrows = 1、ncols = 1、index = 1 且 projection 是“3d”。
遍历标记、x、y 和 z 的列表,以创建散点。
使用 set_xlabel、y_label 和 z_label 方法设置 x、y 和 z 标签。
使用 plt.show() 方法绘制图形。
示例
import matplotlib.pyplot as plt
import numpy as np

np.random.seed(1000)

fig = plt.figure()
ax = fig.add_subplot(111, projection='3d')

n = 100

for m, zl, zh in [('o', -50, -25), ('^', -30, -5)]:
   xs = (32 - 23) * np.random.rand(n) + 23
   ys = (100 - 0) * np.random.rand(n)
   zs = (zh - zl) * np.random.rand(n) + zl
   ax.scatter(xs, ys, zs, marker=m)

ax.set_xlabel('X Label')
ax.set_ylabel('Y Label')
ax.set_zlabel('Z Label')

plt.show()
输出

更新时间:2021 年 9 月 19 日
2K+ 次浏览

广告