
 数据结构
数据结构 网络
网络 RDBMS
RDBMS 操作系统
操作系统 Java
Java iOS
iOS HTML
HTML CSS
CSS Android
 Python
 C 编程
C 编程 C++
C++ C#
C# MongoDB
 MySQL
MySQL Javascript
 PHP
PHP在 Jupyter Notebook 中让 3D 绘图变得互动(Python 和 Matplotlib)
在本文中,我们可以获取一个程序代码来演示如何使用 Jupyter Notebook 使 3D 绘图变得互动。
步骤
创建一个新图形或激活现有图形。
使用子图方法创建 fig 和 ax 变量,其中默认 nrows 和 ncols 为 1,projection=’3d”。
使用 np.cos 和 np.sin 函数获取 x、y 和 z。
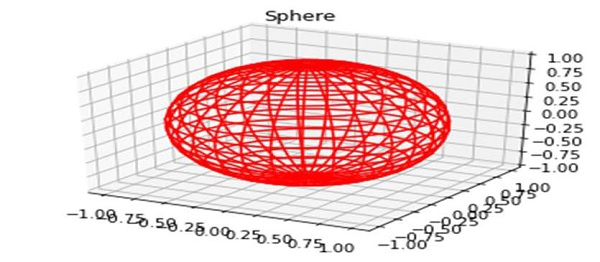
使用 x、y、z 和 color="red" 绘制 3D 线框。
为当前坐标轴设定一个标题。
要显示图形,请使用 plt.show() 方法。
示例
import matplotlib.pyplot as plt
import numpy as np
fig = plt.figure()
ax = fig.add_subplot(111, projection='3d')
u, v = np.mgrid[0:2 * np.pi:30j, 0:np.pi:20j]
x = np.cos(u) * np.sin(v)
y = np.sin(u) * np.sin(v)
z = np.cos(v)
ax.plot_wireframe(x, y, z, color="red")
ax.set_title("Sphere")
plt.show()
输出

更新于: 17-Mar-2021
3K+ 浏览量

广告