
 数据结构
数据结构 网络
网络 RDBMS
RDBMS 操作系统
操作系统 Java
Java iOS
iOS HTML
HTML CSS
CSS Android
 Python
 C 编程
C 编程 C++
C++ C#
C# MongoDB
 MySQL
MySQL Javascript
 PHP
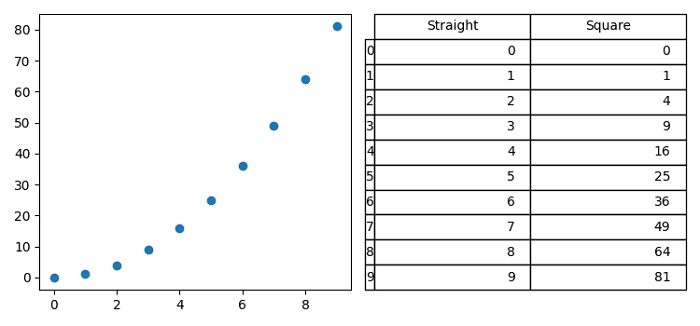
PHP如何在 Jupyter Notebook 中在一个数据框旁边显示一个绘图?
要在绘图旁显示数据框,我们可以采取以下步骤 −
设置图形大小并调整子图之间的和周围的填充。
创建一个键值为 straight 和 square 的 Pandas 数据框。
使用 figure() 方法创建一个新图或激活现有图。
使用 nrows=1, cols=2 和 index=1 向图形添加一个子图。
使用 scatter() 方法绘制数据框点。
使用 nrows=1, cols=2 和 index=2 向图形添加子图。
初始化变量 font_size、bbox 来制作一个表格。
关闭当前坐标轴。
使用 table() 方法向当前坐标轴添加一个表格。
要显示图形,请使用 show() 方法。
示例
import matplotlib.pyplot as plt
import pandas as pd

plt.rcParams["figure.figsize"] = [7.50, 3.50]
plt.rcParams["figure.autolayout"] = True

df = pd.DataFrame({'Straight': [i for i in range(10)],'Square': [i * i for i in range(10)]})

fig = plt.figure()
ax1 = fig.add_subplot(121)
ax1.scatter(x=df.Straight, y=df.Square)
ax2 = fig.add_subplot(122)
font_size = 14
bbox = [0, 0, 1, 1]
ax2.axis('off')
mpl_table = ax2.table(cellText=df.values, rowLabels=df.index, bbox=bbox, colLabels=df.columns)
plt.show()
输出

更新于: 03-06-2021
1K+ 浏览

广告